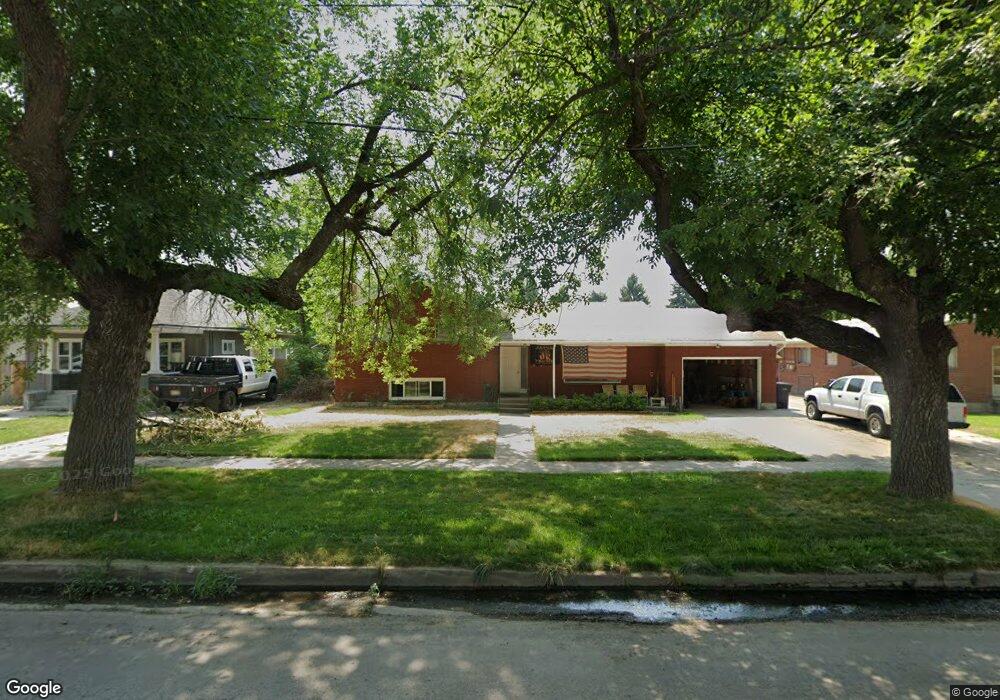
364 W 200 N Logan, UT 84321
Ellis NeighborhoodEstimated Value: $566,000 - $756,000
--
Bed
--
Bath
2,715
Sq Ft
$240/Sq Ft
Est. Value
About This Home
This home is located at 364 W 200 N, Logan, UT 84321 and is currently estimated at $651,000, approximately $239 per square foot. 364 W 200 N is a home with nearby schools including Ellis School, Mount Logan Middle School, and Logan High School.
Ownership History
Date
Name
Owned For
Owner Type
Purchase Details
Closed on
Jun 5, 2013
Sold by
Crosbie Richard H and Crosbie Sherry S
Bought by
Ponderosa Pine Properties Llc
Current Estimated Value
Home Financials for this Owner
Home Financials are based on the most recent Mortgage that was taken out on this home.
Original Mortgage
$147,000
Outstanding Balance
$30,880
Interest Rate
3.37%
Mortgage Type
New Conventional
Estimated Equity
$620,120
Purchase Details
Closed on
Feb 28, 2007
Sold by
Vernon Family Llc
Bought by
Crosbie Richard H and Crosbie Sherry S
Home Financials for this Owner
Home Financials are based on the most recent Mortgage that was taken out on this home.
Original Mortgage
$152,000
Interest Rate
6.21%
Mortgage Type
New Conventional
Purchase Details
Closed on
Feb 27, 2007
Sold by
Crosbie Richard H and Crosbie Sherry S
Bought by
Ponderosa Pine Properties Llc
Home Financials for this Owner
Home Financials are based on the most recent Mortgage that was taken out on this home.
Original Mortgage
$152,000
Interest Rate
6.21%
Mortgage Type
New Conventional
Create a Home Valuation Report for This Property
The Home Valuation Report is an in-depth analysis detailing your home's value as well as a comparison with similar homes in the area
Home Values in the Area
Average Home Value in this Area
Purchase History
| Date | Buyer | Sale Price | Title Company |
|---|---|---|---|
| Ponderosa Pine Properties Llc | -- | Hickman Land Title Company | |
| Crosbie Richard H | -- | Hickman Land Title Company | |
| Crosbie Richard H | -- | Hickman Land Title Company | |
| Ponderosa Pine Properties Llc | -- | American Secure Title |
Source: Public Records
Mortgage History
| Date | Status | Borrower | Loan Amount |
|---|---|---|---|
| Open | Crosbie Richard H | $147,000 | |
| Previous Owner | Crosbie Richard H | $152,000 |
Source: Public Records
Tax History Compared to Growth
Tax History
| Year | Tax Paid | Tax Assessment Tax Assessment Total Assessment is a certain percentage of the fair market value that is determined by local assessors to be the total taxable value of land and additions on the property. | Land | Improvement |
|---|---|---|---|---|
| 2025 | $2,434 | $572,400 | $215,000 | $357,400 |
| 2024 | $2,513 | $572,400 | $215,000 | $357,400 |
| 2023 | $2,452 | $532,400 | $175,000 | $357,400 |
| 2022 | $263 | $532,400 | $175,000 | $357,400 |
| 2021 | $2,843 | $489,800 | $132,400 | $357,400 |
| 2020 | $1,877 | $291,000 | $90,000 | $201,000 |
| 2019 | $1,962 | $291,000 | $90,000 | $201,000 |
| 2018 | $1,550 | $209,888 | $70,000 | $139,888 |
| 2017 | $1,497 | $107,195 | $0 | $0 |
| 2016 | $1,552 | $107,195 | $0 | $0 |
| 2015 | $1,554 | $107,195 | $0 | $0 |
| 2014 | $1,405 | $107,195 | $0 | $0 |
| 2013 | -- | $105,685 | $0 | $0 |
Source: Public Records
Map
Nearby Homes