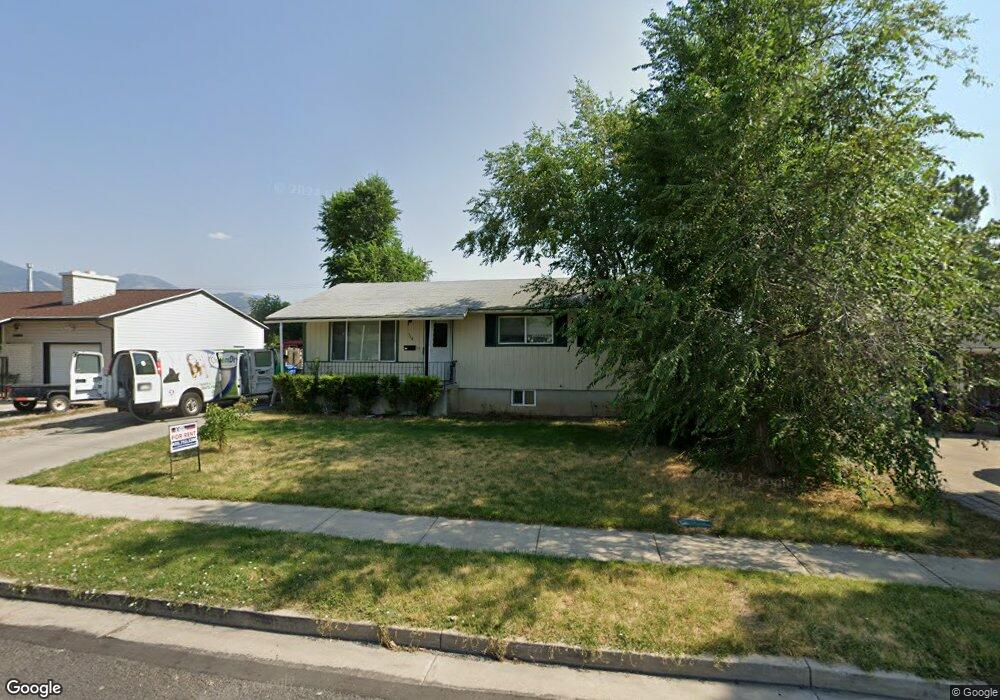
364 W 725 N Logan, UT 84321
Bridger NeighborhoodEstimated Value: $340,000 - $396,000
--
Bed
--
Bath
1,025
Sq Ft
$363/Sq Ft
Est. Value
About This Home
This home is located at 364 W 725 N, Logan, UT 84321 and is currently estimated at $372,218, approximately $363 per square foot. 364 W 725 N is a home with nearby schools including Bridger School, Mount Logan Middle School, and Logan High School.
Ownership History
Date
Name
Owned For
Owner Type
Purchase Details
Closed on
Aug 3, 2007
Sold by
Belliston Nathan and Belliston Aimee
Bought by
Otte Preston and Otte Jessica
Current Estimated Value
Home Financials for this Owner
Home Financials are based on the most recent Mortgage that was taken out on this home.
Original Mortgage
$12,200
Outstanding Balance
$5,429
Interest Rate
6.62%
Mortgage Type
Stand Alone Second
Estimated Equity
$366,789
Purchase Details
Closed on
Mar 14, 2005
Sold by
Belliston Nathan D and Belliston Aimee A
Bought by
Belliston Nathan and Belliston Aimee
Home Financials for this Owner
Home Financials are based on the most recent Mortgage that was taken out on this home.
Original Mortgage
$84,000
Interest Rate
5.61%
Mortgage Type
New Conventional
Create a Home Valuation Report for This Property
The Home Valuation Report is an in-depth analysis detailing your home's value as well as a comparison with similar homes in the area
Home Values in the Area
Average Home Value in this Area
Purchase History
| Date | Buyer | Sale Price | Title Company |
|---|---|---|---|
| Otte Preston | -- | Pinnacle Title Ins Agency | |
| Belliston Nathan | -- | Cache Title Company |
Source: Public Records
Mortgage History
| Date | Status | Borrower | Loan Amount |
|---|---|---|---|
| Open | Otte Preston | $12,200 | |
| Open | Otte Preston | $108,800 | |
| Previous Owner | Belliston Nathan | $84,000 |
Source: Public Records
Tax History Compared to Growth
Tax History
| Year | Tax Paid | Tax Assessment Tax Assessment Total Assessment is a certain percentage of the fair market value that is determined by local assessors to be the total taxable value of land and additions on the property. | Land | Improvement |
|---|---|---|---|---|
| 2025 | $1,693 | $218,980 | $0 | $0 |
| 2024 | $1,748 | $218,980 | $0 | $0 |
| 2023 | $1,824 | $217,770 | $0 | $0 |
| 2022 | $1,633 | $182,025 | $0 | $0 |
| 2021 | $1,538 | $264,960 | $45,000 | $219,960 |
| 2020 | $1,473 | $228,300 | $45,000 | $183,300 |
| 2019 | $1,100 | $163,151 | $45,000 | $118,151 |
| 2018 | $1,072 | $145,128 | $45,000 | $100,128 |
| 2017 | $999 | $71,530 | $0 | $0 |
| 2016 | $1,036 | $71,530 | $0 | $0 |
| 2015 | $1,037 | $71,530 | $0 | $0 |
| 2014 | $914 | $69,750 | $0 | $0 |
| 2013 | -- | $69,750 | $0 | $0 |
Source: Public Records
Map
Nearby Homes