364 W Chestnut St Unit 2F Brockton, MA 02301
Clifton Heights NeighborhoodEstimated Value: $758,738 - $855,000
2
Beds
1
Bath
1,000
Sq Ft
$800/Sq Ft
Est. Value
About This Home
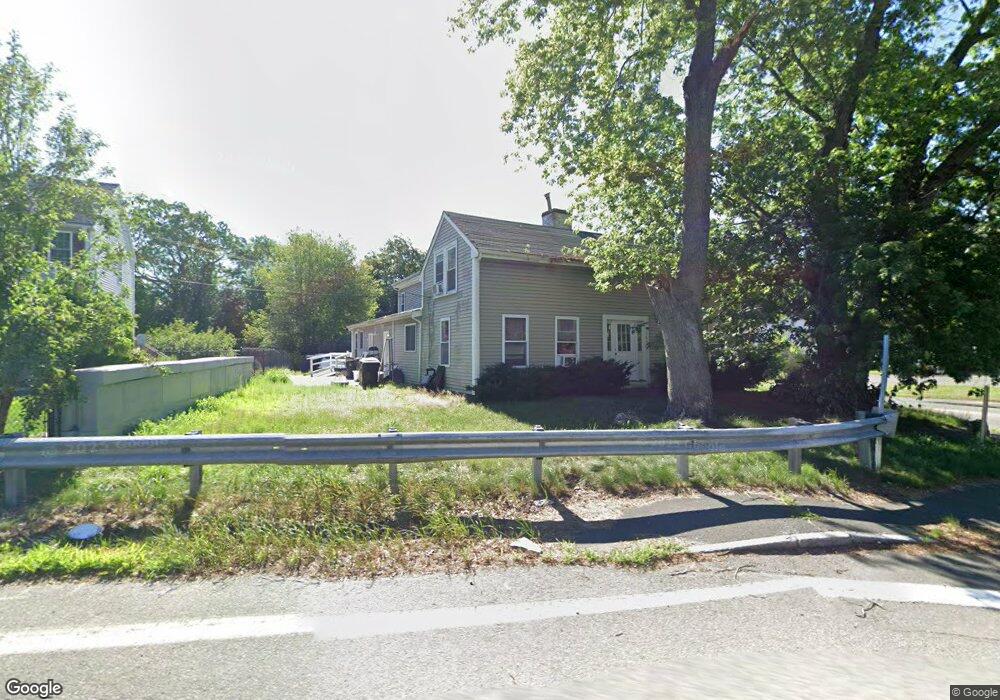
This home is located at 364 W Chestnut St Unit 2F, Brockton, MA 02301 and is currently estimated at $800,185, approximately $800 per square foot. 364 W Chestnut St Unit 2F is a home located in Plymouth County with nearby schools including Gilmore Elementary School, John F. Kennedy Elementary School, and Davis K-8 School.
Ownership History
Date
Name
Owned For
Owner Type
Purchase Details
Closed on
Dec 21, 2018
Sold by
Roukous Mark
Bought by
Laifook Dane
Current Estimated Value
Home Financials for this Owner
Home Financials are based on the most recent Mortgage that was taken out on this home.
Original Mortgage
$473,646
Outstanding Balance
$415,770
Interest Rate
4.62%
Mortgage Type
FHA
Estimated Equity
$384,415
Purchase Details
Closed on
Feb 2, 2007
Sold by
Haikal George A
Bought by
Hill Christine E
Home Financials for this Owner
Home Financials are based on the most recent Mortgage that was taken out on this home.
Original Mortgage
$352,512
Interest Rate
6.16%
Mortgage Type
Purchase Money Mortgage
Purchase Details
Closed on
May 18, 2006
Sold by
Roukous Mark
Bought by
Haikal George
Home Financials for this Owner
Home Financials are based on the most recent Mortgage that was taken out on this home.
Original Mortgage
$260,000
Interest Rate
6.42%
Mortgage Type
Purchase Money Mortgage
Purchase Details
Closed on
Jun 22, 1995
Sold by
Brockton Cu
Bought by
Roukous Mark
Purchase Details
Closed on
Apr 5, 1995
Sold by
Yeskis Anthony P and Yeskis Gail L
Bought by
Brockton Cu
Create a Home Valuation Report for This Property
The Home Valuation Report is an in-depth analysis detailing your home's value as well as a comparison with similar homes in the area
Home Values in the Area
Average Home Value in this Area
Purchase History
| Date | Buyer | Sale Price | Title Company |
|---|---|---|---|
| Laifook Dane | $490,000 | -- | |
| Hill Christine E | $391,680 | -- | |
| Haikal George | $140,000 | -- | |
| Roukous Mark | $65,000 | -- | |
| Brockton Cu | $63,000 | -- |
Source: Public Records
Mortgage History
| Date | Status | Borrower | Loan Amount |
|---|---|---|---|
| Open | Laifook Dane | $473,646 | |
| Previous Owner | Brockton Cu | $352,512 | |
| Previous Owner | Brockton Cu | $260,000 |
Source: Public Records
Tax History Compared to Growth
Tax History
| Year | Tax Paid | Tax Assessment Tax Assessment Total Assessment is a certain percentage of the fair market value that is determined by local assessors to be the total taxable value of land and additions on the property. | Land | Improvement |
|---|---|---|---|---|
| 2025 | $7,611 | $628,500 | $140,800 | $487,700 |
| 2024 | $8,299 | $690,400 | $140,800 | $549,600 |
| 2023 | $8,641 | $665,700 | $107,800 | $557,900 |
| 2022 | $8,891 | $636,400 | $98,000 | $538,400 |
| 2021 | $8,107 | $559,100 | $82,200 | $476,900 |
| 2020 | $7,143 | $471,500 | $76,300 | $395,200 |
| 2019 | $4,813 | $309,700 | $74,200 | $235,500 |
| 2018 | $4,387 | $277,500 | $74,200 | $203,300 |
| 2017 | $4,387 | $272,500 | $74,200 | $198,300 |
| 2016 | $4,158 | $239,500 | $72,100 | $167,400 |
| 2015 | $3,174 | $174,900 | $72,100 | $102,800 |
| 2014 | $3,182 | $175,500 | $72,100 | $103,400 |
Source: Public Records
Map
Nearby Homes
- 364 W Chestnut St
- 358 W Chestnut St
- 197 Southworth St
- 352 W Chestnut St
- 363 W Chestnut St
- 191 Southworth St
- 344 W Chestnut St
- 25 Mercedes Rd
- 186 Southworth St
- 17 Mercedes Rd
- 17 Mercedes Rd Unit 1
- 9 Mercedes Rd
- 185 Southworth St
- 33 Mercedes Rd
- 41 Mercedes Rd
- 323 Cambo St
- 180 Southworth St
- 179 Southworth St
- 393 W Chestnut St
- 396 W Chestnut St