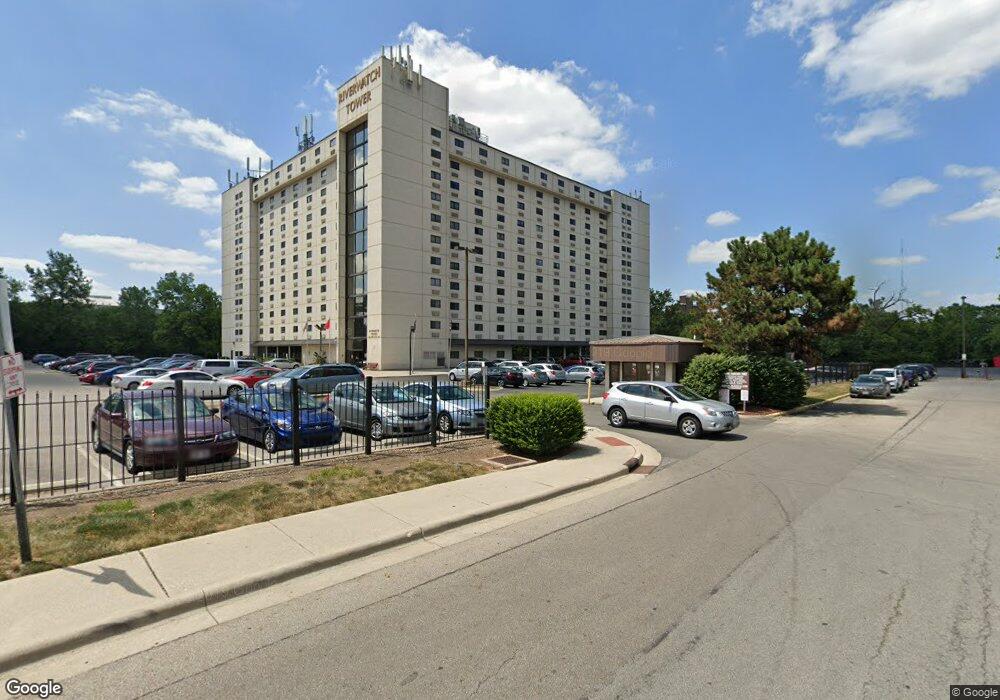
364 W Lane Ave Unit P39 Columbus, OH 43201
Northwood Park NeighborhoodEstimated Value: $204,000 - $255,000
1
Bed
1
Bath
756
Sq Ft
$305/Sq Ft
Est. Value
About This Home
This home is located at 364 W Lane Ave Unit P39, Columbus, OH 43201 and is currently estimated at $230,893, approximately $305 per square foot. 364 W Lane Ave Unit P39 is a home located in Franklin County with nearby schools including Hubbard Elementary School, Dominion Middle School, and Whetstone High School.
Ownership History
Date
Name
Owned For
Owner Type
Purchase Details
Closed on
Mar 31, 2008
Sold by
Baker Stephen
Bought by
Casbarro Patrick J and Casbarro Kathryn Ruth
Current Estimated Value
Purchase Details
Closed on
Feb 20, 2005
Sold by
Peters Marcus Anita and Craig Marcus
Bought by
Baker Stephen
Home Financials for this Owner
Home Financials are based on the most recent Mortgage that was taken out on this home.
Original Mortgage
$68,000
Interest Rate
5.8%
Mortgage Type
Purchase Money Mortgage
Purchase Details
Closed on
Aug 31, 2001
Sold by
Ignash Daniel S
Bought by
Marcus Anita Peters and Marcus Melissa
Purchase Details
Closed on
Mar 28, 1996
Sold by
Walter G Maurer Trst
Bought by
Daniel S Ignash
Home Financials for this Owner
Home Financials are based on the most recent Mortgage that was taken out on this home.
Original Mortgage
$45,000
Interest Rate
8.5%
Mortgage Type
New Conventional
Purchase Details
Closed on
May 27, 1994
Create a Home Valuation Report for This Property
The Home Valuation Report is an in-depth analysis detailing your home's value as well as a comparison with similar homes in the area
Home Values in the Area
Average Home Value in this Area
Purchase History
| Date | Buyer | Sale Price | Title Company |
|---|---|---|---|
| Casbarro Patrick J | $108,000 | Powell | |
| Baker Stephen | $85,000 | Powell Tit | |
| Marcus Anita Peters | $69,000 | -- | |
| Daniel S Ignash | $50,000 | -- | |
| -- | -- | -- |
Source: Public Records
Mortgage History
| Date | Status | Borrower | Loan Amount |
|---|---|---|---|
| Previous Owner | Baker Stephen | $68,000 | |
| Previous Owner | Daniel S Ignash | $45,000 |
Source: Public Records
Tax History Compared to Growth
Tax History
| Year | Tax Paid | Tax Assessment Tax Assessment Total Assessment is a certain percentage of the fair market value that is determined by local assessors to be the total taxable value of land and additions on the property. | Land | Improvement |
|---|---|---|---|---|
| 2024 | $3,112 | $67,910 | $25,030 | $42,880 |
| 2023 | $3,073 | $67,900 | $25,025 | $42,875 |
| 2022 | $2,688 | $50,580 | $12,250 | $38,330 |
| 2021 | $2,693 | $50,580 | $12,250 | $38,330 |
| 2020 | $2,697 | $50,580 | $12,250 | $38,330 |
| 2019 | $2,246 | $36,120 | $8,750 | $27,370 |
| 2018 | $1,121 | $36,120 | $8,750 | $27,370 |
| 2017 | $2,246 | $36,120 | $8,750 | $27,370 |
| 2016 | $2,378 | $35,000 | $10,500 | $24,500 |
| 2015 | $1,082 | $35,000 | $10,500 | $24,500 |
| 2014 | $2,170 | $35,000 | $10,500 | $24,500 |
| 2013 | $973 | $31,815 | $9,555 | $22,260 |
Source: Public Records
Map
Nearby Homes
- 2394 Neil Ave
- 9 E Norwich Ave Unit 15
- 6 E Blake Ave
- 2683 Neil Ave Unit 685
- 204 E Blake Ave Unit 206
- 223-225 E Maynard Ave
- 217 E Oakland Ave
- 223 E Patterson Ave
- 69 E Arcadia Ave
- 241 E Blake Ave
- 109-117 E Arcadia Ave
- 261 E Northwood Ave Unit 40
- 2537 Medary Ave Unit 539
- 2127 Indiana Ave
- 116 Olentangy Point Unit J116
- 1878 Kenny Rd
- 2350 Indiana Ave
- 2103 Iuka Ave
- 368 Alden Ave Unit 368
- 2395 Summit St Unit 397
- 364 W Lane Ave Unit 26
- 364 W Lane Ave Unit 933
- 364 W Lane Ave Unit 1037
- 364 W Lane Ave Unit 413
- 364 W Lane Ave Unit 629
- 364 W Lane Ave Unit 1031
- 364 W Lane Ave Unit 439
- 364 W Lane Ave Unit 706
- 364 W Lane Ave Unit P25
- 364 W Lane Ave Unit 922
- 364 W Lane Ave Unit 222
- 364 W Lane Ave Unit 703
- 364 W Lane Ave Unit P24
- 364 W Lane Ave Unit 409
- 364 W Lane Ave Unit 339
- 364 W Lane Ave Unit 302
- 364 W Lane Ave Unit 915
- 364 W Lane Ave Unit 405
- 364 W Lane Ave
- 364 W Lane Ave Unit 522