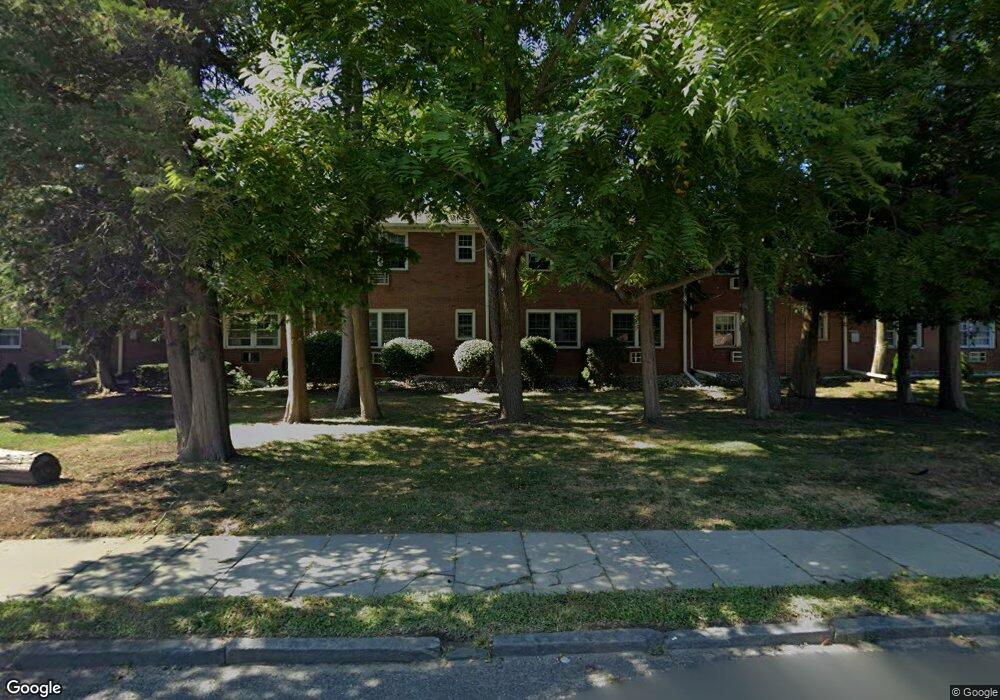
364 Westwood Ave Unit 35 Long Branch, NJ 07740
Estimated Value: $272,000 - $591,461
1
Bed
1
Bath
832
Sq Ft
$429/Sq Ft
Est. Value
About This Home
This home is located at 364 Westwood Ave Unit 35, Long Branch, NJ 07740 and is currently estimated at $357,115, approximately $429 per square foot. 364 Westwood Ave Unit 35 is a home located in Monmouth County with nearby schools including Long Branch High School, Holy Trinity School, and Bet Yaakov of the Jersey Shore.
Ownership History
Date
Name
Owned For
Owner Type
Purchase Details
Closed on
Jun 2, 2023
Sold by
Westwood Village Condominium Association
Bought by
Given Not
Current Estimated Value
Purchase Details
Closed on
Jun 30, 2022
Sold by
Lowy House Llc
Bought by
Ridgway Thomas
Home Financials for this Owner
Home Financials are based on the most recent Mortgage that was taken out on this home.
Original Mortgage
$183,750
Interest Rate
5.1%
Mortgage Type
New Conventional
Purchase Details
Closed on
Dec 11, 2017
Sold by
Janet S Kiss D 4 A Special Needs Trust
Bought by
House Zachary and House Amy
Purchase Details
Closed on
Mar 29, 2017
Sold by
Daiboch Alfred F
Bought by
Armstrong Susan and Janet S Kiss Trust
Purchase Details
Closed on
Mar 7, 1996
Sold by
First Union Nat Bk
Bought by
Marass Nelson
Create a Home Valuation Report for This Property
The Home Valuation Report is an in-depth analysis detailing your home's value as well as a comparison with similar homes in the area
Home Values in the Area
Average Home Value in this Area
Purchase History
| Date | Buyer | Sale Price | Title Company |
|---|---|---|---|
| Given Not | -- | None Listed On Document | |
| Given Not | -- | None Listed On Document | |
| Given Not | -- | None Listed On Document | |
| Ridgway Thomas | $245,000 | New Title Company Name | |
| Redacted Upon Request | $245,000 | New Title Company Name | |
| House Zachary | $122,500 | American Land Title | |
| Armstrong Susan | -- | None Available | |
| Marass Nelson | $23,000 | -- |
Source: Public Records
Mortgage History
| Date | Status | Borrower | Loan Amount |
|---|---|---|---|
| Previous Owner | Redacted Upon Request | $183,750 |
Source: Public Records
Tax History Compared to Growth
Tax History
| Year | Tax Paid | Tax Assessment Tax Assessment Total Assessment is a certain percentage of the fair market value that is determined by local assessors to be the total taxable value of land and additions on the property. | Land | Improvement |
|---|---|---|---|---|
| 2025 | $3,779 | $253,100 | $156,000 | $97,100 |
| 2024 | $3,441 | $245,900 | $153,000 | $92,900 |
| 2023 | $3,441 | $221,600 | $133,000 | $88,600 |
| 2022 | $2,819 | $169,000 | $100,000 | $69,000 |
| 2021 | $2,819 | $140,900 | $70,000 | $70,900 |
| 2020 | $2,623 | $125,500 | $55,000 | $70,500 |
| 2019 | $1,980 | $94,200 | $27,000 | $67,200 |
| 2018 | $1,941 | $91,800 | $27,000 | $64,800 |
| 2017 | $1,865 | $90,500 | $27,000 | $63,500 |
| 2016 | $1,797 | $88,900 | $27,000 | $61,900 |
| 2015 | $1,824 | $81,900 | $20,000 | $61,900 |
| 2014 | $1,690 | $80,000 | $55,000 | $25,000 |
Source: Public Records
Map
Nearby Homes
- 364 Westwood Ave Unit 39
- 364 Westwood Ave Unit 71
- 364 Westwood Ave Unit 21
- 377 Westwood Ave
- 303 Westwood Ave
- 434 Westwood Ave
- 215 Cleveland Ave
- 298 Poole Ave
- 369 Indiana Ave
- 23 Woolley Ave
- 237 3rd Ave Unit 1-4
- 279 W West End Ave
- 440 W End Ave
- 12 Coral Place
- 399 Willow Ave
- 552 Westwood Ave
- 464 2nd Ave
- 264 Norwood Ave
- 144 Westwood Ave
- 119 Avery Ave Unit H21
- 364 Westwood Ave
- 364 Westwood Ave Unit 52
- 364 Westwood Ave Unit 57
- 364 Westwood Ave Unit 40
- 364 Westwood Ave Unit 4
- 364 Westwood Ave Unit 89
- 364 Westwood Ave Unit 15
- 364 Westwood Ave Unit 59
- 364 Westwood Ave Unit 80
- 364 Westwood Ave Unit 74
- 364 Westwood Ave Unit 32
- 364 Westwood Ave Unit 68
- 364 Westwood Ave Unit 16
- 364 Westwood Ave Unit 37
- 364 Westwood Ave Unit 18
- 364 Westwood Ave Unit 19
- 364 Westwood Ave Unit 3
- 364 Westwood Ave Unit 10
- 364 Westwood Ave Unit 88
- 364 Westwood Ave Unit 46