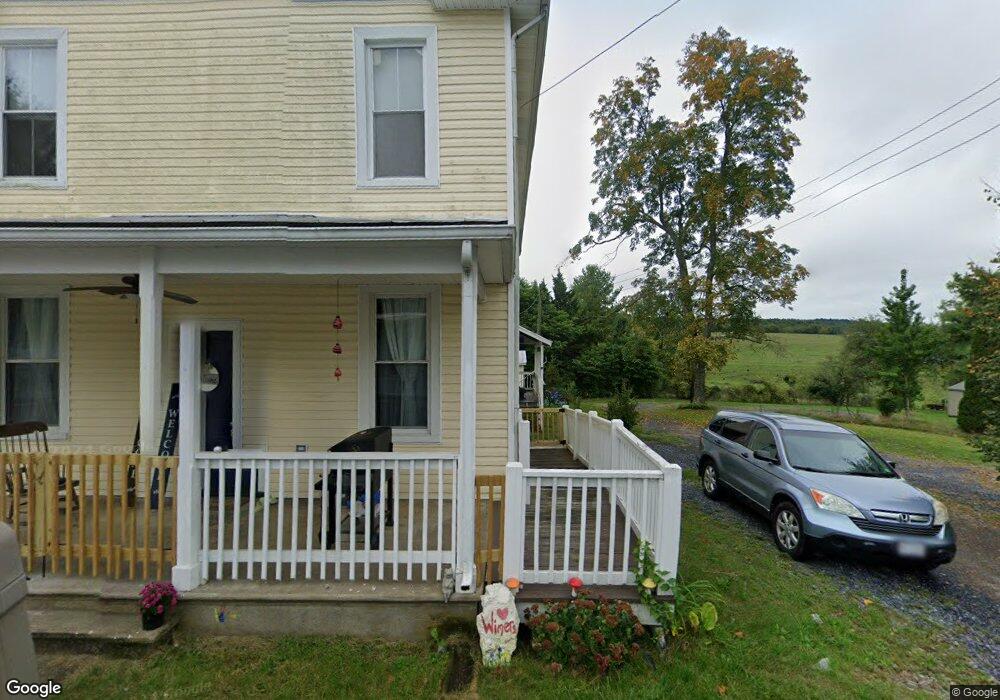
3640 Middlebrook Village Rd Middlebrook, VA 24459
Estimated Value: $251,485 - $337,000
5
Beds
3
Baths
2,550
Sq Ft
$113/Sq Ft
Est. Value
About This Home
This home is located at 3640 Middlebrook Village Rd, Middlebrook, VA 24459 and is currently estimated at $288,371, approximately $113 per square foot. 3640 Middlebrook Village Rd is a home located in Augusta County with nearby schools including Riverheads Elementary School, Beverley Manor Middle School, and Riverheads High School.
Ownership History
Date
Name
Owned For
Owner Type
Purchase Details
Closed on
Jul 19, 2019
Sold by
Fogle Heather A
Bought by
Wimer Gregory and Wimer Ashley R
Current Estimated Value
Home Financials for this Owner
Home Financials are based on the most recent Mortgage that was taken out on this home.
Original Mortgage
$171,800
Outstanding Balance
$150,512
Interest Rate
3.82%
Mortgage Type
FHA
Estimated Equity
$137,859
Purchase Details
Closed on
May 29, 2018
Sold by
Renaissance Llc
Bought by
Fogle Heather A
Purchase Details
Closed on
Jul 21, 2017
Sold by
Prickett Andrew W and Prickett Whitney S
Bought by
Renaissance Llc
Home Financials for this Owner
Home Financials are based on the most recent Mortgage that was taken out on this home.
Original Mortgage
$85,000
Interest Rate
3.9%
Mortgage Type
Credit Line Revolving
Create a Home Valuation Report for This Property
The Home Valuation Report is an in-depth analysis detailing your home's value as well as a comparison with similar homes in the area
Purchase History
| Date | Buyer | Sale Price | Title Company |
|---|---|---|---|
| Wimer Gregory | $175,000 | -- | |
| Fogle Heather A | $125,000 | -- | |
| Renaissance Llc | $85,000 | None Available |
Source: Public Records
Mortgage History
| Date | Status | Borrower | Loan Amount |
|---|---|---|---|
| Open | Wimer Gregory | $171,800 | |
| Previous Owner | Renaissance Llc | $85,000 |
Source: Public Records
Tax History
| Year | Tax Paid | Tax Assessment Tax Assessment Total Assessment is a certain percentage of the fair market value that is determined by local assessors to be the total taxable value of land and additions on the property. | Land | Improvement |
|---|---|---|---|---|
| 2025 | $1,104 | $212,300 | $55,000 | $157,300 |
| 2024 | $615 | $214,300 | $55,000 | $159,300 |
| 2023 | $615 | $97,600 | $35,000 | $62,600 |
| 2022 | $615 | $97,600 | $35,000 | $62,600 |
| 2021 | $615 | $97,600 | $35,000 | $62,600 |
| 2020 | $615 | $97,600 | $35,000 | $62,600 |
| 2019 | $615 | $97,600 | $35,000 | $62,600 |
| 2018 | $590 | $93,699 | $35,000 | $58,699 |
| 2017 | $543 | $93,699 | $35,000 | $58,699 |
| 2016 | $543 | $93,699 | $35,000 | $58,699 |
| 2015 | -- | $93,699 | $35,000 | $58,699 |
| 2014 | -- | $93,699 | $35,000 | $58,699 |
| 2013 | -- | $93,500 | $35,000 | $58,500 |
Source: Public Records
Map
Nearby Homes
- 235 Howardsville Rd
- 2062 Middlebrook Rd
- 122 Hull Hills Ln
- 115 Hull Hills Ln
- 1221 Miller Farm Rd
- 80 Riverhead Dr
- 32 Riverhead Dr
- 1099 Broadhead School Rd
- 13 Indian Ridge Rd
- Ln
- 0 Chestnut Ridge Rd Unit VAAG2000440
- 77 Rosebud Ln
- 2594 Lee Jackson Hwy
- TBD Smoky Row Rd
- 1370 Middlebrook Rd
- 51 Marshall Ln
- TBD Horseshoe Hollow
- 0 Estaline Valley Rd
- 1448 Stuarts Draft Hwy
- 296 Otts Mill Rd
- 3644 Middlebrook Village Rd
- 3643 Middlebrook Rd
- 3620 Middlebrook Rd
- 3641 Middlebrook Rd
- 3619 Middlebrook Rd
- 3620 Middlebrook Village Rd
- 3630 Middlebrook Village Rd
- 3648 Middlebrook Village Rd
- 3672 Middlebrook Village Rd
- 3678 Middlebrook Village Rd
- 3682 Middlebrook Village Rd
- 3688 Middlebrook Village Rd
- 3696 Middlebrook Village Rd
- 3603 Middlebrook Village Rd
- 3679 Middlebrook Village Rd
- 3653 Middlebrook Village Rd
- 3615 Middlebrook Village Rd
- 3662 Middlebrook Village Rd
- 3609 Middlebrook Rd
- 3659 Middlebrook Village Rd
Your Personal Tour Guide
Ask me questions while you tour the home.