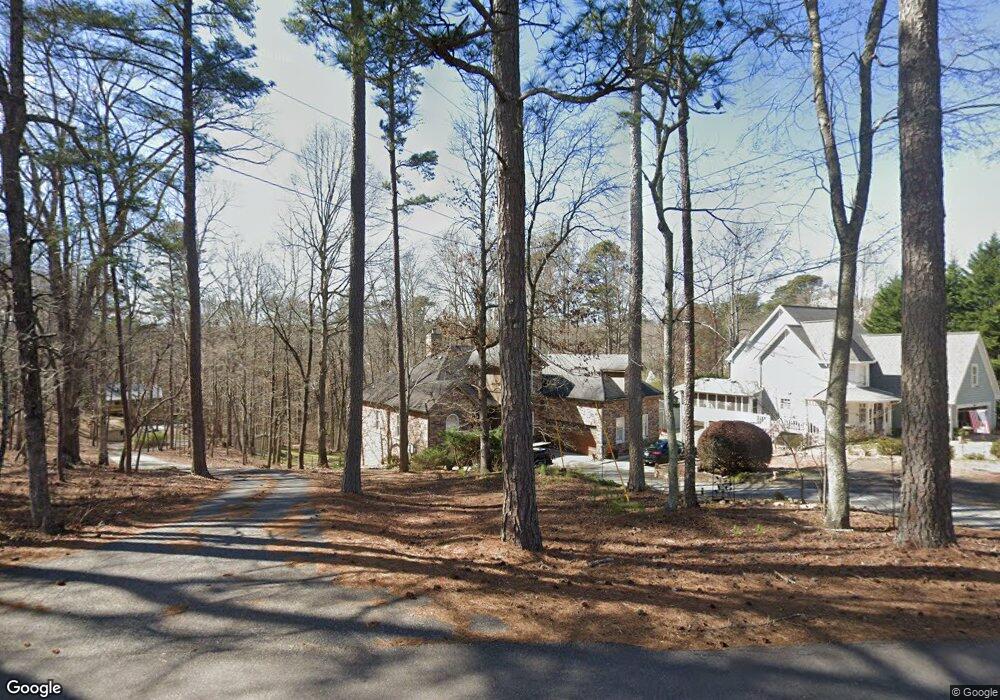
3640 Sinclair Shores Rd Cumming, GA 30041
Lake Lanier NeighborhoodEstimated Value: $623,601 - $763,000
3
Beds
3
Baths
2,602
Sq Ft
$268/Sq Ft
Est. Value
About This Home
This home is located at 3640 Sinclair Shores Rd, Cumming, GA 30041 and is currently estimated at $696,150, approximately $267 per square foot. 3640 Sinclair Shores Rd is a home located in Forsyth County with nearby schools including Chattahoochee Elementary School and Little Mill Middle School.
Ownership History
Date
Name
Owned For
Owner Type
Purchase Details
Closed on
Jun 5, 2000
Sold by
Morales Edith N
Bought by
Pickler Jennifer W
Current Estimated Value
Home Financials for this Owner
Home Financials are based on the most recent Mortgage that was taken out on this home.
Original Mortgage
$179,200
Outstanding Balance
$64,659
Interest Rate
8.55%
Mortgage Type
New Conventional
Estimated Equity
$631,491
Purchase Details
Closed on
Dec 31, 1997
Sold by
Foursquare Prop Inc
Bought by
Morales Edith N
Home Financials for this Owner
Home Financials are based on the most recent Mortgage that was taken out on this home.
Original Mortgage
$143,500
Interest Rate
11.3%
Mortgage Type
New Conventional
Purchase Details
Closed on
Sep 14, 1994
Sold by
Turner Daniel
Bought by
Foursquare Prop Inc
Home Financials for this Owner
Home Financials are based on the most recent Mortgage that was taken out on this home.
Original Mortgage
$150,000
Interest Rate
8.51%
Mortgage Type
Construction
Create a Home Valuation Report for This Property
The Home Valuation Report is an in-depth analysis detailing your home's value as well as a comparison with similar homes in the area
Home Values in the Area
Average Home Value in this Area
Purchase History
| Date | Buyer | Sale Price | Title Company |
|---|---|---|---|
| Pickler Jennifer W | $224,000 | -- | |
| Morales Edith N | $205,000 | -- | |
| Foursquare Prop Inc | $25,000 | -- |
Source: Public Records
Mortgage History
| Date | Status | Borrower | Loan Amount |
|---|---|---|---|
| Open | Pickler Jennifer W | $179,200 | |
| Previous Owner | Morales Edith N | $143,500 | |
| Previous Owner | Foursquare Prop Inc | $150,000 |
Source: Public Records
Tax History Compared to Growth
Tax History
| Year | Tax Paid | Tax Assessment Tax Assessment Total Assessment is a certain percentage of the fair market value that is determined by local assessors to be the total taxable value of land and additions on the property. | Land | Improvement |
|---|---|---|---|---|
| 2025 | $4,201 | $229,576 | $70,000 | $159,576 |
| 2024 | $4,201 | $209,408 | $54,000 | $155,408 |
| 2023 | $3,534 | $190,916 | $48,000 | $142,916 |
| 2022 | $3,662 | $130,756 | $28,800 | $101,956 |
| 2021 | $3,262 | $130,756 | $28,800 | $101,956 |
| 2020 | $3,146 | $125,180 | $28,800 | $96,380 |
| 2019 | $2,955 | $115,688 | $20,000 | $95,688 |
| 2018 | $2,788 | $107,232 | $20,000 | $87,232 |
| 2017 | $2,579 | $96,864 | $20,000 | $76,864 |
| 2016 | $2,579 | $96,864 | $20,000 | $76,864 |
| 2015 | $2,584 | $96,864 | $20,000 | $76,864 |
| 2014 | $2,308 | $90,452 | $20,000 | $70,452 |
Source: Public Records
Map
Nearby Homes
- 5345 Pilgrim Point Rd
- 4710 Chevy St
- 0 Mercedes Dr Unit 7660832
- 4050 Vintage Ct
- 5380 Renault St
- 3520 Hope Rd
- 4045 Merritt Dr
- 2955 Pilgrim Mill Rd
- 5425 Belvedere St
- 4040 Merritt Dr
- 5660 Mercedes Dr
- 3590 Fleming Dr
- 5560 Pilgrim Point Extension
- 3630 Hope Rd
- 2860 Pilgrim Mill Rd
- 3045 Imperial Dr
- 2320 Pilgrim Mill Way
- 0 Imperial Dr Unit 10555771
- 0 Imperial Dr Unit 7608242
- 4190 Heather Way
- 3630 Sinclair Shores Rd
- 4565 Bonneville Dr
- 4545 Bonneville Dr
- 4910 Brookwood Dr
- 4535 Bonneville Dr
- 3635 Sinclair Shores Rd
- 3635 Sinclair Shores Rd Unit 1
- 4865 Brookwood Dr
- 4870 Brookwood Dr
- 3645 Sinclair Shores Rd
- 4490 Bonneville Dr
- 4855 Brookwood Dr
- 3660 Sinclair Shores Rd
- 4830 Brookwood Dr
- 4845 Brookwood Dr
- 3650 Sinclair Shores Rd
- 4835 Brookwood Dr
- 4485 Bonneville Dr
- 4480 Bonneville Dr
- 3540 Beaver Cove Rd