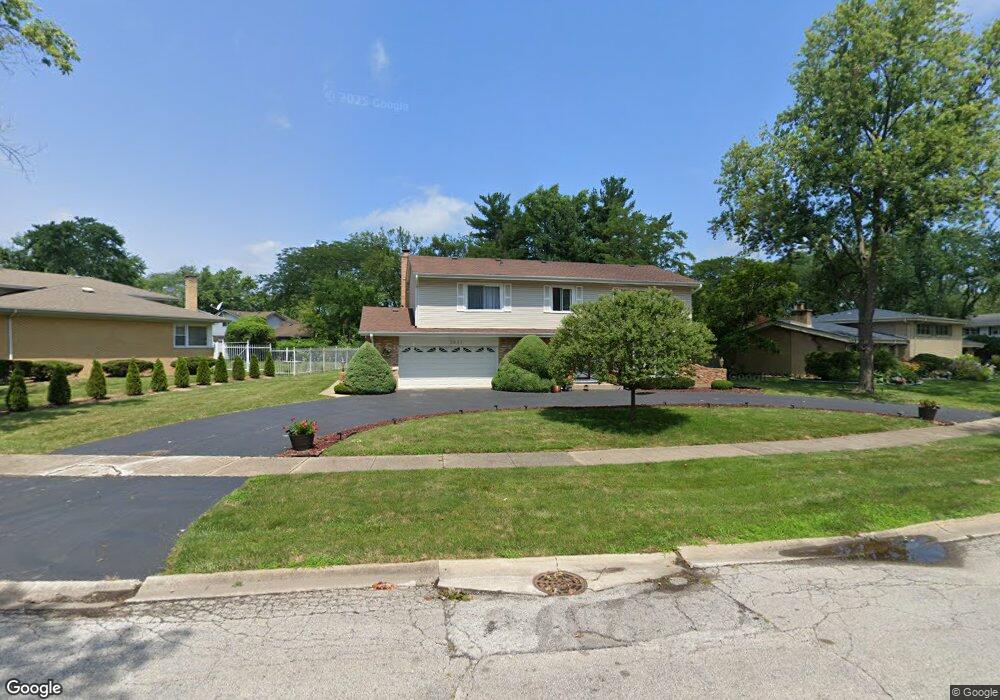
3641 Poplar Rd Flossmoor, IL 60422
Estimated Value: $350,000 - $437,000
6
Beds
5
Baths
3,284
Sq Ft
$121/Sq Ft
Est. Value
About This Home
This home is located at 3641 Poplar Rd, Flossmoor, IL 60422 and is currently estimated at $396,930, approximately $120 per square foot. 3641 Poplar Rd is a home located in Cook County with nearby schools including Flossmoor Hills Elementary School, Parker Junior High School, and Homewood-Flossmoor High School.
Ownership History
Date
Name
Owned For
Owner Type
Purchase Details
Closed on
Jun 2, 2021
Sold by
Mccaskill Archie and Lynch Mccaskill Vanessa
Bought by
Raices Edith R
Current Estimated Value
Home Financials for this Owner
Home Financials are based on the most recent Mortgage that was taken out on this home.
Original Mortgage
$265,109
Outstanding Balance
$242,091
Interest Rate
3.87%
Mortgage Type
FHA
Estimated Equity
$154,839
Purchase Details
Closed on
Jul 11, 1997
Sold by
Beverly Trust Company
Bought by
Mccaskill Archie L and Mccaskill Vanessa L
Home Financials for this Owner
Home Financials are based on the most recent Mortgage that was taken out on this home.
Original Mortgage
$148,500
Interest Rate
5.62%
Create a Home Valuation Report for This Property
The Home Valuation Report is an in-depth analysis detailing your home's value as well as a comparison with similar homes in the area
Home Values in the Area
Average Home Value in this Area
Purchase History
| Date | Buyer | Sale Price | Title Company |
|---|---|---|---|
| Raices Edith R | $270,000 | Affinity Title | |
| Mccaskill Archie L | $165,000 | -- |
Source: Public Records
Mortgage History
| Date | Status | Borrower | Loan Amount |
|---|---|---|---|
| Open | Raices Edith R | $265,109 | |
| Previous Owner | Mccaskill Archie L | $148,500 |
Source: Public Records
Tax History
| Year | Tax Paid | Tax Assessment Tax Assessment Total Assessment is a certain percentage of the fair market value that is determined by local assessors to be the total taxable value of land and additions on the property. | Land | Improvement |
|---|---|---|---|---|
| 2025 | $10,655 | $31,000 | $5,182 | $25,818 |
| 2024 | $10,655 | $31,000 | $5,182 | $25,818 |
| 2023 | $9,993 | $31,000 | $5,182 | $25,818 |
| 2022 | $9,993 | $24,736 | $4,572 | $20,164 |
| 2021 | $9,740 | $24,736 | $4,572 | $20,164 |
| 2020 | $11,167 | $24,736 | $4,572 | $20,164 |
| 2019 | $11,061 | $23,955 | $4,267 | $19,688 |
| 2018 | $10,642 | $23,955 | $4,267 | $19,688 |
| 2017 | $10,479 | $23,955 | $4,267 | $19,688 |
| 2016 | $10,133 | $21,630 | $3,962 | $17,668 |
| 2015 | $10,115 | $21,630 | $3,962 | $17,668 |
| 2014 | $9,569 | $21,630 | $3,962 | $17,668 |
| 2013 | $10,025 | $24,362 | $3,962 | $20,400 |
Source: Public Records
Map
Nearby Homes
- 1034 Central Park Ave
- 3533 Flossmoor Rd
- 835 Maple Rd
- 3712 Beech St
- 3641 Beech St
- 19002 Springfield Ave
- 754 Central Park Ave
- 3949 Flossmoor Rd
- 3742 Beech St
- 18840 Harding Ave
- 3710 Briar Ln
- 18941 Cypress Ave Unit 2
- 19020 Kedzie Ave
- 3800 River Rd
- 4008 192nd Place
- 18623 Augusta Ln
- 18951 Chestnut Ave
- 4121 191st Ct Unit 69
- 19211 Elm Dr Unit 145
- 19221 Elm Dr Unit 150