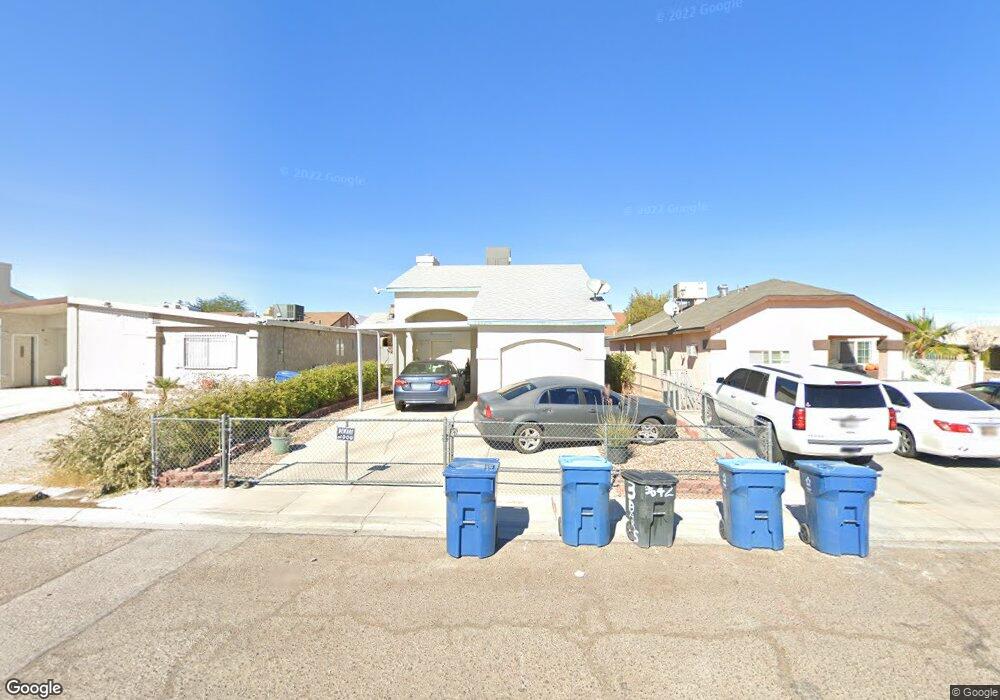
3642 Three Bars Ct Las Vegas, NV 89115
Estimated Value: $273,000 - $316,000
2
Beds
2
Baths
960
Sq Ft
$297/Sq Ft
Est. Value
About This Home
This home is located at 3642 Three Bars Ct, Las Vegas, NV 89115 and is currently estimated at $285,012, approximately $296 per square foot. 3642 Three Bars Ct is a home located in Clark County with nearby schools including Clyde C. Cox Elementary School, Gwendolyn Woolley Elementary School, and Von Tobel Middle School.
Ownership History
Date
Name
Owned For
Owner Type
Purchase Details
Closed on
May 18, 2017
Sold by
Wotz Cindee M
Bought by
Woltz Cindee M and The Woltz Family Trust
Current Estimated Value
Purchase Details
Closed on
May 18, 2006
Sold by
Latona Martin and Woltz Cindee M
Bought by
Latona Martin and Woltz Cindee M
Purchase Details
Closed on
Mar 14, 2001
Sold by
Woltz Cindee M
Bought by
Latona Martin and Woltz Cindee M
Purchase Details
Closed on
Jul 30, 1999
Sold by
Latoma Martin T
Bought by
Woltz Cindee M
Purchase Details
Closed on
Jul 20, 1999
Sold by
Va
Bought by
Woltz Cindee M
Purchase Details
Closed on
Mar 15, 1999
Sold by
Bank United
Bought by
Va
Purchase Details
Closed on
Mar 11, 1999
Sold by
Ledyard Robert Mallory and Ledyard Zora A
Bought by
Bank United
Purchase Details
Closed on
Apr 18, 1994
Sold by
Tristao Genie Louise and Ledyard Robert M
Bought by
Ledyard Robert M and Ledyard Zora A
Create a Home Valuation Report for This Property
The Home Valuation Report is an in-depth analysis detailing your home's value as well as a comparison with similar homes in the area
Home Values in the Area
Average Home Value in this Area
Purchase History
| Date | Buyer | Sale Price | Title Company |
|---|---|---|---|
| Woltz Cindee M | -- | None Available | |
| Latona Martin | -- | None Available | |
| Latona Martin | -- | -- | |
| Woltz Cindee M | -- | -- | |
| Woltz Cindee M | -- | -- | |
| Va | -- | First American Title Co | |
| Bank United | $68,044 | First American Title Co | |
| Ledyard Robert M | -- | Fidelity National Title |
Source: Public Records
Tax History Compared to Growth
Tax History
| Year | Tax Paid | Tax Assessment Tax Assessment Total Assessment is a certain percentage of the fair market value that is determined by local assessors to be the total taxable value of land and additions on the property. | Land | Improvement |
|---|---|---|---|---|
| 2025 | $569 | $51,483 | $22,050 | $29,433 |
| 2024 | $569 | $51,483 | $22,050 | $29,433 |
| 2023 | $569 | $50,668 | $22,400 | $28,268 |
| 2022 | $553 | $43,879 | $17,850 | $26,029 |
| 2021 | $537 | $42,054 | $17,150 | $24,904 |
| 2020 | $518 | $39,872 | $15,050 | $24,822 |
| 2019 | $503 | $36,928 | $12,250 | $24,678 |
| 2018 | $489 | $31,890 | $8,050 | $23,840 |
| 2017 | $916 | $31,225 | $7,000 | $24,225 |
| 2016 | $464 | $22,321 | $4,550 | $17,771 |
| 2015 | $428 | $24,174 | $4,200 | $19,974 |
| 2014 | -- | $14,313 | $2,800 | $11,513 |
Source: Public Records
Map
Nearby Homes
- 3630 Three Bars Ct
- 3540 Purdue
- 3501 Orvis St
- 3327 Rio Grande St
- 3401 N Walnut Rd Unit 330
- 3401 N Walnut Rd Unit 121
- 3401 N Walnut Rd Unit 113
- 3401 N Walnut Rd Unit 109
- 3401 N Walnut Rd Unit 388
- 3401 N Walnut Rd Unit 235
- 3401 N Walnut Rd Unit 15
- 3401 N Walnut Rd Unit 236
- 3401 N Walnut Rd Unit 74
- 3401 N Walnut Rd Unit 13
- 3401 N Walnut Rd Unit 6
- 3401 N Walnut Rd Unit 402
- 3401 N Walnut Rd Unit 249
- 3401 N Walnut Rd Unit 304
- 3401 N Walnut Rd Unit 67
- 3401 N Walnut Rd Unit 107
- 3636 Three Bars Ct
- 3648 Three Bars Ct
- 3641 Whispring Native Ct
- 3624 Three Bars Ct
- 3635 Whispring Native Ct
- 3647 Whispring Native Ct
- 3629 Whispring Native Ct
- 3618 Three Bars Ct
- 3618 Three Bars Ct Unit n/a
- 3643 Three Bars Ct
- 3637 Three Bars Ct
- 3649 Three Bars Ct
- 3631 Three Bars Ct
- 3617 Whispring Native Ct
- 3612 Three Bars Ct
- 3556 Covey Ln
- 3625 Three Bars Ct
- 3546 Covey Ln
- 3566 Covey Ln