Estimated Value: $318,000 - $358,000
4
Beds
3
Baths
2,800
Sq Ft
$122/Sq Ft
Est. Value
About This Home
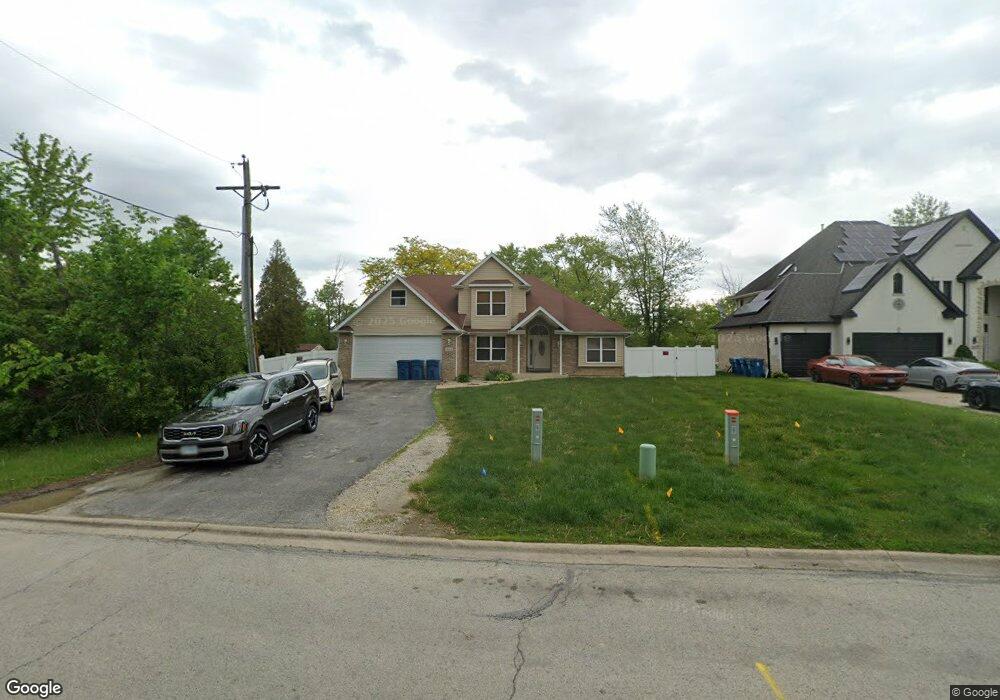
This home is located at 3643 S State St, Crete, IL 60417 and is currently estimated at $340,417, approximately $121 per square foot. 3643 S State St is a home located in Will County with nearby schools including Crete Elementary School, Crete-Monee Middle School, and Crete-Monee High School.
Ownership History
Date
Name
Owned For
Owner Type
Purchase Details
Closed on
Feb 14, 2012
Sold by
Clausell Steven and Clausell Jessica
Bought by
Verdun Nicole
Current Estimated Value
Home Financials for this Owner
Home Financials are based on the most recent Mortgage that was taken out on this home.
Original Mortgage
$138,989
Outstanding Balance
$97,384
Interest Rate
4.37%
Mortgage Type
FHA
Estimated Equity
$243,033
Purchase Details
Closed on
Jun 2, 2006
Sold by
Neri Vince and Neri Builders
Bought by
Clausell Steven and Clausell Jessica
Home Financials for this Owner
Home Financials are based on the most recent Mortgage that was taken out on this home.
Original Mortgage
$222,400
Interest Rate
7.85%
Mortgage Type
Balloon
Purchase Details
Closed on
Jun 29, 2005
Sold by
Tatem Leighton and Tatem Edjuana J
Bought by
Crawford Louis
Create a Home Valuation Report for This Property
The Home Valuation Report is an in-depth analysis detailing your home's value as well as a comparison with similar homes in the area
Home Values in the Area
Average Home Value in this Area
Purchase History
| Date | Buyer | Sale Price | Title Company |
|---|---|---|---|
| Verdun Nicole | $133,000 | Premier Title | |
| Clausell Steven | $276,000 | Chicago Title Insurance Co | |
| Crawford Louis | $12,500 | Chicago Title Insurance Co |
Source: Public Records
Mortgage History
| Date | Status | Borrower | Loan Amount |
|---|---|---|---|
| Open | Verdun Nicole | $138,989 | |
| Previous Owner | Clausell Steven | $222,400 |
Source: Public Records
Tax History Compared to Growth
Tax History
| Year | Tax Paid | Tax Assessment Tax Assessment Total Assessment is a certain percentage of the fair market value that is determined by local assessors to be the total taxable value of land and additions on the property. | Land | Improvement |
|---|---|---|---|---|
| 2024 | $9,668 | $96,728 | $17,746 | $78,982 |
| 2023 | $9,668 | $86,372 | $15,846 | $70,526 |
| 2022 | $8,462 | $76,762 | $14,083 | $62,679 |
| 2021 | $7,949 | $70,282 | $12,894 | $57,388 |
| 2020 | $7,692 | $65,868 | $12,084 | $53,784 |
| 2019 | $7,328 | $61,906 | $11,357 | $50,549 |
| 2018 | $7,074 | $60,574 | $11,113 | $49,461 |
| 2017 | $6,937 | $55,803 | $10,238 | $45,565 |
| 2016 | $7,333 | $55,443 | $10,172 | $45,271 |
| 2015 | $7,017 | $53,959 | $9,900 | $44,059 |
| 2014 | $7,017 | $56,296 | $11,792 | $44,504 |
| 2013 | $7,017 | $63,544 | $12,357 | $51,187 |
Source: Public Records
Map
Nearby Homes
- 873 Yorkshire Terrace
- 3604 Tee Ct N
- 1605 W Richton Rd
- 106 Cornwall Dr
- 3755 S State St
- 837 Dorsetshire Dr
- 8 Berk Ln
- 395 Surrey Ln Unit 3
- 3449 Somerset St
- 3505 Haweswood Dr
- 200 Durham Dr
- 246 Lakeview Ct
- 262 Lakeview Ct
- 205 Hereford Ave
- 129 Dorsetshire Dr
- 274 E 34th St
- Lot# 8 Saint Andrews Dr
- Lot# 9 Saint Andrews Dr
- Lot# 10 Saint Andrews Dr
- Lot#s 8, 9, 10 Saint Andrews Dr