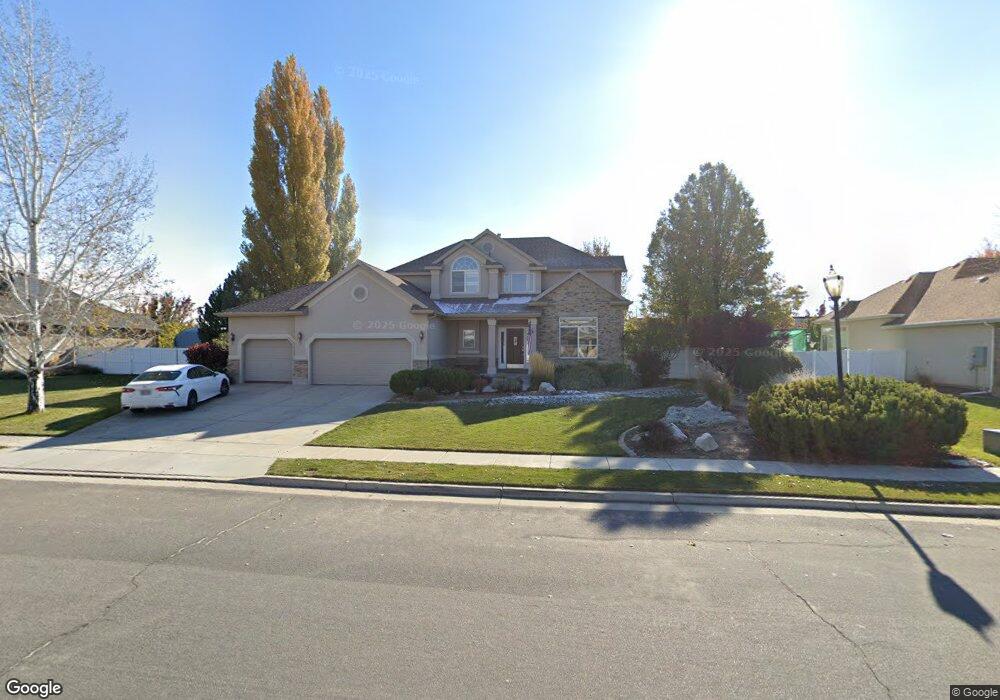
3643 W 775 N Layton, UT 84041
Estimated Value: $704,000 - $796,000
4
Beds
3
Baths
4,149
Sq Ft
$181/Sq Ft
Est. Value
About This Home
This home is located at 3643 W 775 N, Layton, UT 84041 and is currently estimated at $750,853, approximately $180 per square foot. 3643 W 775 N is a home located in Davis County with nearby schools including Sand Springs Elementary School, Legacy Junior High School, and Layton High School.
Ownership History
Date
Name
Owned For
Owner Type
Purchase Details
Closed on
Feb 7, 2017
Sold by
Robinson Christopher A and Robinson Shannon K
Bought by
Robinson Family Trust
Current Estimated Value
Purchase Details
Closed on
May 26, 2005
Sold by
Armstrong Sean and Armstrong Ilka
Bought by
Robinson Christopher A and Robinson Shannon K
Home Financials for this Owner
Home Financials are based on the most recent Mortgage that was taken out on this home.
Original Mortgage
$210,000
Interest Rate
5.72%
Mortgage Type
Fannie Mae Freddie Mac
Purchase Details
Closed on
Nov 19, 2002
Sold by
Gmw Development Inc
Bought by
Armstrong Sean and Armstrong Ilka
Home Financials for this Owner
Home Financials are based on the most recent Mortgage that was taken out on this home.
Original Mortgage
$218,991
Interest Rate
5.89%
Create a Home Valuation Report for This Property
The Home Valuation Report is an in-depth analysis detailing your home's value as well as a comparison with similar homes in the area
Home Values in the Area
Average Home Value in this Area
Purchase History
We collect this data history from publicly available records. To have your information removed, we recommend requesting removal directly through your county’s website.
| Date | Buyer | Sale Price | Title Company |
|---|---|---|---|
| Robinson Family Trust | -- | -- | |
| Robinson Christopher A | -- | Aspen Title Insurance Agency | |
| Armstrong Sean | -- | Bonneville Title Company Inc |
Source: Public Records
Mortgage History
We collect this data history from publicly available records. To have your information removed, we recommend requesting removal directly through your county’s website.
| Date | Status | Borrower | Loan Amount |
|---|---|---|---|
| Previous Owner | Robinson Christopher A | $210,000 | |
| Previous Owner | Armstrong Sean | $218,991 | |
| Closed | Armstrong Sean | $41,060 |
Source: Public Records
Tax History
| Year | Tax Paid | Tax Assessment Tax Assessment Total Assessment is a certain percentage of the fair market value that is determined by local assessors to be the total taxable value of land and additions on the property. | Land | Improvement |
|---|---|---|---|---|
| 2025 | $3,678 | $386,100 | $139,110 | $246,990 |
| 2024 | $3,729 | $394,350 | $147,478 | $246,872 |
| 2023 | $3,638 | $678,000 | $159,033 | $518,967 |
| 2022 | $3,869 | $391,600 | $90,647 | $300,953 |
| 2021 | $3,504 | $529,000 | $135,934 | $393,066 |
| 2020 | $3,183 | $461,000 | $116,676 | $344,324 |
| 2019 | $3,060 | $434,000 | $114,039 | $319,961 |
| 2018 | $2,858 | $407,000 | $100,638 | $306,362 |
| 2016 | $2,666 | $195,855 | $42,472 | $153,383 |
| 2015 | $2,704 | $188,595 | $42,472 | $146,123 |
| 2014 | $2,266 | $161,571 | $42,472 | $119,099 |
| 2013 | -- | $170,118 | $39,264 | $130,854 |
Source: Public Records
Map
Nearby Homes
- 719 N 3500 W
- 3246 W 850 N Unit 114
- 3266 W 850 N Unit 115
- 1097 N 3450 W
- 3250 W 1075 N
- 2480 S Main St
- 78 E 2550 S
- 921 W 2700 S
- 967 W Yamada Ct
- 2258 S 400 W
- 2368 S 825 W
- 1095 N 2925 W
- 1125 W 3090 S
- 34 S 3600 W
- 15 N 3300 W
- 1257 W 2850 S
- 2786 S 1260 W
- 90 S Freedom Farms Dr
- 78 S Freedom Farms Dr
- 816 N 2700 W
Your Personal Tour Guide
Ask me questions while you tour the home.