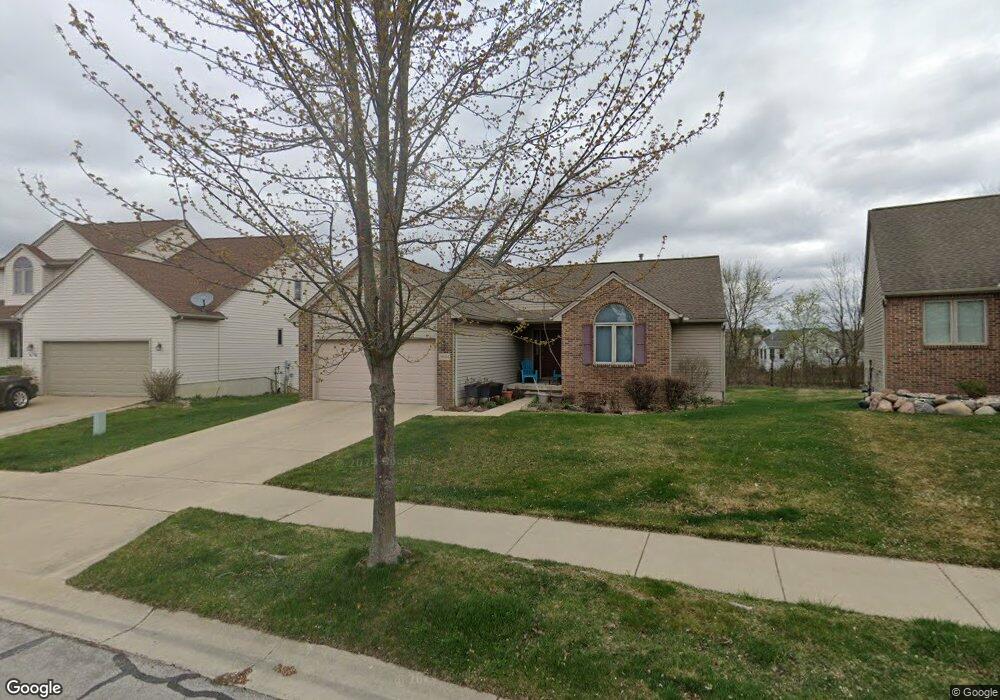
3644 S Downs Dr Unit 218 Dexter, MI 48130
Estimated Value: $424,000 - $478,000
3
Beds
2
Baths
1,419
Sq Ft
$317/Sq Ft
Est. Value
About This Home
This home is located at 3644 S Downs Dr Unit 218, Dexter, MI 48130 and is currently estimated at $449,858, approximately $317 per square foot. 3644 S Downs Dr Unit 218 is a home located in Washtenaw County with nearby schools including Anchor Elementary School, Creekside Intermediate School, and Bates Elementary School.
Ownership History
Date
Name
Owned For
Owner Type
Purchase Details
Closed on
Aug 22, 2018
Sold by
Suppes Keith M
Bought by
Suppes Keith M and Suppes Jennifer M
Current Estimated Value
Home Financials for this Owner
Home Financials are based on the most recent Mortgage that was taken out on this home.
Original Mortgage
$164,000
Outstanding Balance
$100,111
Interest Rate
4.5%
Mortgage Type
New Conventional
Estimated Equity
$349,747
Purchase Details
Closed on
Mar 20, 2012
Sold by
Suppers Keith M and Suppes Jennifer S
Bought by
Suppes Keith M and The Keith Suppes Revocable Trust
Purchase Details
Closed on
Apr 21, 2011
Sold by
Suppes Keith M
Bought by
Suppes Keith M and Suppes Jennifer
Home Financials for this Owner
Home Financials are based on the most recent Mortgage that was taken out on this home.
Original Mortgage
$184,000
Interest Rate
4.77%
Mortgage Type
New Conventional
Purchase Details
Closed on
Feb 7, 2005
Sold by
Dexter Development Llc
Bought by
Suppes Keith M
Home Financials for this Owner
Home Financials are based on the most recent Mortgage that was taken out on this home.
Original Mortgage
$202,520
Interest Rate
5.78%
Mortgage Type
Fannie Mae Freddie Mac
Create a Home Valuation Report for This Property
The Home Valuation Report is an in-depth analysis detailing your home's value as well as a comparison with similar homes in the area
Home Values in the Area
Average Home Value in this Area
Purchase History
| Date | Buyer | Sale Price | Title Company |
|---|---|---|---|
| Suppes Keith M | -- | Fidelity National Title | |
| Suppes Keith M | -- | None Available | |
| Suppes Keith M | -- | None Available | |
| Suppes Keith M | $63,430 | -- | |
| Suppes Keith M | -- | -- |
Source: Public Records
Mortgage History
| Date | Status | Borrower | Loan Amount |
|---|---|---|---|
| Open | Suppes Keith M | $164,000 | |
| Closed | Suppes Keith M | $184,000 | |
| Closed | Suppes Keith M | $202,520 |
Source: Public Records
Tax History Compared to Growth
Tax History
| Year | Tax Paid | Tax Assessment Tax Assessment Total Assessment is a certain percentage of the fair market value that is determined by local assessors to be the total taxable value of land and additions on the property. | Land | Improvement |
|---|---|---|---|---|
| 2025 | $6,099 | $216,700 | $0 | $0 |
| 2024 | $3,580 | $197,900 | $0 | $0 |
| 2023 | $3,418 | $193,400 | $0 | $0 |
| 2022 | $5,610 | $188,400 | $0 | $0 |
| 2021 | $5,447 | $166,400 | $0 | $0 |
| 2020 | $5,377 | $153,700 | $0 | $0 |
| 2019 | $5,244 | $148,800 | $148,800 | $0 |
| 2018 | $5,024 | $139,800 | $25,000 | $114,800 |
| 2017 | $4,830 | $139,800 | $0 | $0 |
| 2016 | $4,802 | $104,428 | $0 | $0 |
Source: Public Records
Map
Nearby Homes
- 3625 S Downs Dr
- 3544 Lexington Cir
- 280 Victoria Dr
- 305 Victoria Dr
- 306 Cambridge Dr
- 3035 Inverness St
- 1625 Baker Rd
- 6837 Morrison Hills Ct
- 6825 Morrison Hls Ct
- 2925 Baker Rd
- 7795 Ann Arbor St
- 6810 Morrison Hills Ct
- 603 Woodland Dr
- 610 Boardwalk Ln
- 611 Woodland Dr
- 7919 Grand St
- 621 Woodland Dr
- 7955 Forest St
- 3576 Central St
- 0 W Joy Rd
- 3640 S Downs Dr Unit 219
- 3648 S Downs Dr Unit 217
- 3636 S Downs Dr Unit 220
- 3652 S Downs Dr Unit 128
- 3641 S Downs Dr
- 3649 S Downs Dr
- 0 S Downs Dr
- 3632 S Downs Dr Unit 221
- 3656 S Downs Dr Unit 129
- 3635 S Downs Dr Unit 214
- 3657 S Downs Dr Unit 127
- 3729 Bristol Dr
- 3631 S Downs Dr
- 3628 S Downs Dr Unit 222
- 3524 Lexington Cir
- 3528 Lexington Cir
- 3660 S Downs Dr Unit 130
- 3665 S Downs Dr
- 3665 S Downs Dr Unit 126
- 3725 Bristol Dr Unit 153