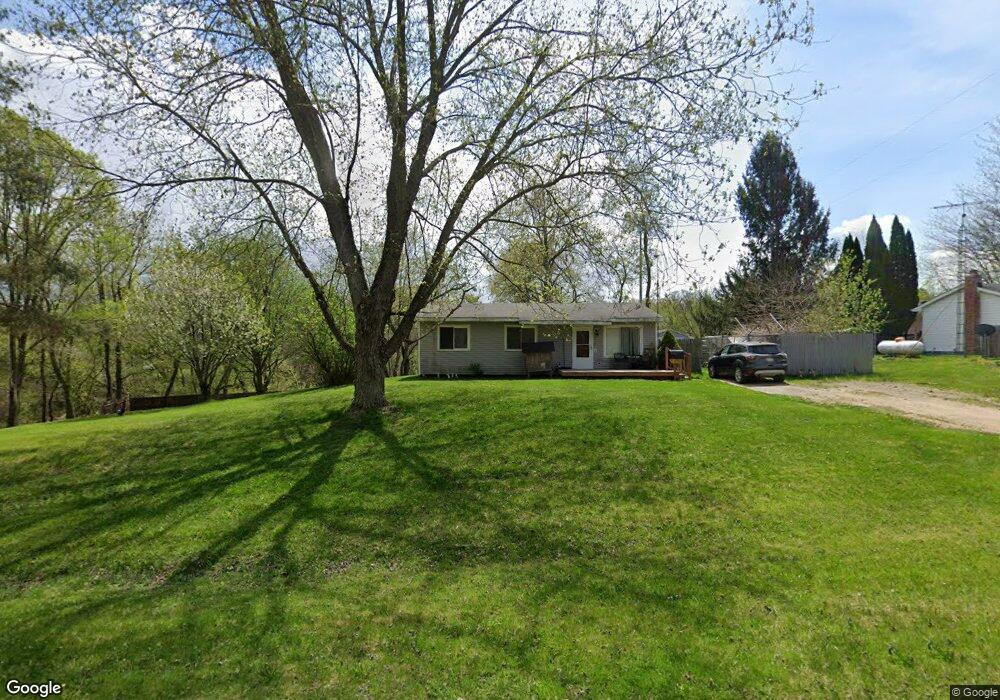
3645 Steinacker Rd Howell, MI 48855
Estimated Value: $191,398 - $290,000
3
Beds
1
Bath
912
Sq Ft
$266/Sq Ft
Est. Value
About This Home
This home is located at 3645 Steinacker Rd, Howell, MI 48855 and is currently estimated at $242,350, approximately $265 per square foot. 3645 Steinacker Rd is a home located in Livingston County with nearby schools including Voyager Elementary School, Highlander Way Middle School, and Howell High School.
Ownership History
Date
Name
Owned For
Owner Type
Purchase Details
Closed on
Jan 18, 2001
Sold by
Parson Carley D
Bought by
Parson Carley D and Parson Joan L
Current Estimated Value
Purchase Details
Closed on
Oct 10, 2000
Sold by
Papizzo Daniel D and Smith Deanna M
Bought by
Parson Carley D
Purchase Details
Closed on
Jul 28, 1999
Sold by
Kuehnle David B and Kuehnle Valerie D
Bought by
Papizzo Daniel D and Smith Deanna M
Create a Home Valuation Report for This Property
The Home Valuation Report is an in-depth analysis detailing your home's value as well as a comparison with similar homes in the area
Home Values in the Area
Average Home Value in this Area
Purchase History
| Date | Buyer | Sale Price | Title Company |
|---|---|---|---|
| Parson Carley D | -- | -- | |
| Parson Carley D | $125,000 | Select Title Company | |
| Papizzo Daniel D | $115,000 | Title Office |
Source: Public Records
Tax History
| Year | Tax Paid | Tax Assessment Tax Assessment Total Assessment is a certain percentage of the fair market value that is determined by local assessors to be the total taxable value of land and additions on the property. | Land | Improvement |
|---|---|---|---|---|
| 2025 | $624 | $86,400 | $0 | $0 |
| 2024 | $606 | $83,100 | $0 | $0 |
| 2023 | $579 | $73,100 | $0 | $0 |
| 2022 | $850 | $69,100 | $0 | $0 |
| 2021 | $826 | $64,500 | $0 | $0 |
| 2020 | $831 | $59,400 | $0 | $0 |
| 2019 | $821 | $49,800 | $0 | $0 |
| 2018 | $809 | $43,300 | $0 | $0 |
| 2017 | $799 | $43,300 | $0 | $0 |
| 2016 | $797 | $42,400 | $0 | $0 |
| 2014 | $900 | $35,400 | $0 | $0 |
| 2012 | $900 | $31,300 | $0 | $0 |
Source: Public Records
Map
Nearby Homes
- N Schrepfer Rd
- L Schrepfer Rd
- 9631 Byron Rd
- 0 Hayner Rd Unit 20251044211
- 6160 Brambleberry Ln
- Pine Knob Rd Lot Unit WP001
- VL W Bruff Rd
- 966 Nancy Ann Dr
- 5647 Owosso Rd
- 4742 Crandall Rd
- 6192 Summerbrooke Cir
- 6275 Summerbrooke Cir
- 5236 Autumn Kirsten Dr
- 6156 Summerbrooke Cir
- 00 N Burkhart Rd
- 2160 E Jones Rd
- 9697 Marsh Rd
- 5407 Oak Grove Rd
- 7653 Chase Lake Rd
- 1315 W Marr Rd
- 3631 Steinacker Rd
- 8490 Antcliff Rd
- 3621 Steinacker Rd
- 8420 Antcliff Rd
- 0 Steinacker Rd
- 0 Steinacker Rd
- 0 Parcel B Steinacker Rd
- 0 Parcel A Steinacker Rd
- Parcel A Steinacker Rd
- Parcel B Steinacker Rd
- 3601 Steinacker Rd
- 3611 Steinacker Rd
- 8520 Antcliff Rd
- 3627 Steinacker Rd
- 3593 Steinacker Rd
- 8447 Antcliff Rd
- 8417 Antcliff Rd
- 8547 Antcliff Rd
- 8559 Antcliff Rd
- 4747 Pinetree Hollow Dr
Your Personal Tour Guide
Ask me questions while you tour the home.