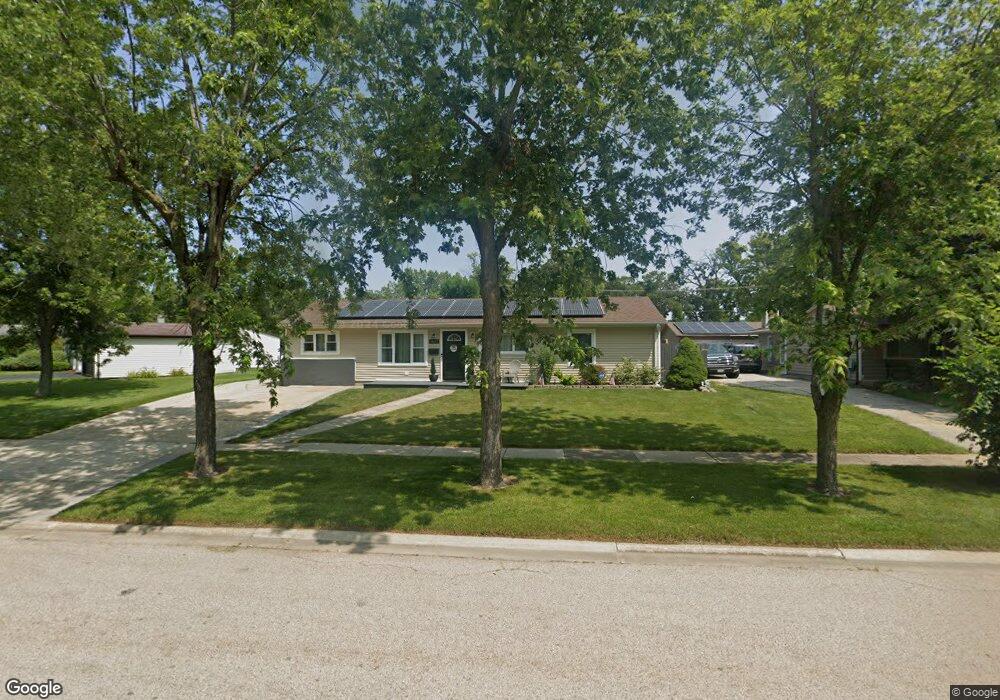
36467 N Douglas Terrace Gurnee, IL 60031
Estimated Value: $272,000 - $294,000
--
Bed
2
Baths
1,325
Sq Ft
$213/Sq Ft
Est. Value
About This Home
This home is located at 36467 N Douglas Terrace, Gurnee, IL 60031 and is currently estimated at $282,656, approximately $213 per square foot. 36467 N Douglas Terrace is a home located in Lake County with nearby schools including Woodland Primary School, Woodland Intermediate School, and Woodland Elementary School.
Ownership History
Date
Name
Owned For
Owner Type
Purchase Details
Closed on
Jul 15, 2003
Sold by
Jakab Andrei and Jakab Daniela
Bought by
Gajek Edyta and Gajek Marcin
Current Estimated Value
Home Financials for this Owner
Home Financials are based on the most recent Mortgage that was taken out on this home.
Original Mortgage
$164,350
Interest Rate
5.62%
Mortgage Type
Purchase Money Mortgage
Purchase Details
Closed on
Jun 14, 2002
Sold by
Lopez Gabriel and Lopez Ruth Patricia
Bought by
Jakab Andrei and Jakab Daniela
Home Financials for this Owner
Home Financials are based on the most recent Mortgage that was taken out on this home.
Original Mortgage
$144,000
Interest Rate
6.7%
Purchase Details
Closed on
Oct 31, 1995
Sold by
Jackson Bruce A
Bought by
Lopez Gabriel and Lopez Ruth Patricia
Home Financials for this Owner
Home Financials are based on the most recent Mortgage that was taken out on this home.
Original Mortgage
$120,961
Interest Rate
7.65%
Mortgage Type
FHA
Create a Home Valuation Report for This Property
The Home Valuation Report is an in-depth analysis detailing your home's value as well as a comparison with similar homes in the area
Home Values in the Area
Average Home Value in this Area
Purchase History
| Date | Buyer | Sale Price | Title Company |
|---|---|---|---|
| Gajek Edyta | $173,000 | -- | |
| Jakab Andrei | $160,000 | -- | |
| Lopez Gabriel | $122,000 | -- |
Source: Public Records
Mortgage History
| Date | Status | Borrower | Loan Amount |
|---|---|---|---|
| Previous Owner | Gajek Edyta | $164,350 | |
| Previous Owner | Jakab Andrei | $144,000 | |
| Previous Owner | Lopez Gabriel | $120,961 |
Source: Public Records
Tax History Compared to Growth
Tax History
| Year | Tax Paid | Tax Assessment Tax Assessment Total Assessment is a certain percentage of the fair market value that is determined by local assessors to be the total taxable value of land and additions on the property. | Land | Improvement |
|---|---|---|---|---|
| 2024 | $6,985 | $84,616 | $13,925 | $70,691 |
| 2023 | $6,611 | $76,271 | $12,551 | $63,720 |
| 2022 | $6,611 | $67,407 | $13,057 | $54,350 |
| 2021 | $5,763 | $62,214 | $12,051 | $50,163 |
| 2020 | $5,548 | $60,685 | $11,755 | $48,930 |
| 2019 | $5,438 | $58,923 | $11,414 | $47,509 |
| 2018 | $4,528 | $51,115 | $15,633 | $35,482 |
| 2017 | $4,528 | $49,650 | $15,185 | $34,465 |
| 2016 | $4,490 | $47,439 | $14,509 | $32,930 |
| 2015 | $4,334 | $44,991 | $13,760 | $31,231 |
| 2014 | $3,817 | $41,472 | $14,407 | $27,065 |
| 2012 | $4,103 | $41,789 | $14,517 | $27,272 |
Source: Public Records
Map
Nearby Homes
- 18229 W Banbury Dr
- 18325 W Lakeview Terrace
- 36712 N Traer Terrace
- 17876 W Braewick Rd
- 17781 W Elsbury St
- 18595 W Judy Dr
- 17820 W Braewick Rd
- 17775 W Braewick Rd
- 36259 N Field View Dr
- 18758 W Highfield Dr
- 17925 W Stearns School Rd
- 18705 W Ash Dr
- 1603 Napa Dr
- 36688 N Yew Tree Dr
- 36217 N Old Creek Ct
- 1601 Newgate Ct
- 1593 Vineyard Dr
- 36873 N Deer Trail Dr
- 7623 Beringer Ct
- 7631 Beringer Ct
- 36455 N Douglas Terrace
- 36477 N Douglas Terrace
- 36439 N Douglas Terrace
- 36489 N Douglas Terrace
- 36423 N Douglas Terrace
- 36474 N Douglas Terrace
- 36460 N Douglas Terrace
- 36453 N Hutchins Rd
- 36446 N Douglas Terrace
- 36499 N Douglas Terrace
- 36441 N Hutchins Rd
- 36517 N Douglas Terrace
- 36507 N Douglas Terrace
- 36409 N Douglas Terrace
- 36531 N Douglas Terrace
- 36428 N Douglas Terrace
- 36473 N Edgewood Dr
- 36461 N Edgewood Dr
- 36423 N Hutchins Rd
- 36540 N Hutchins Rd