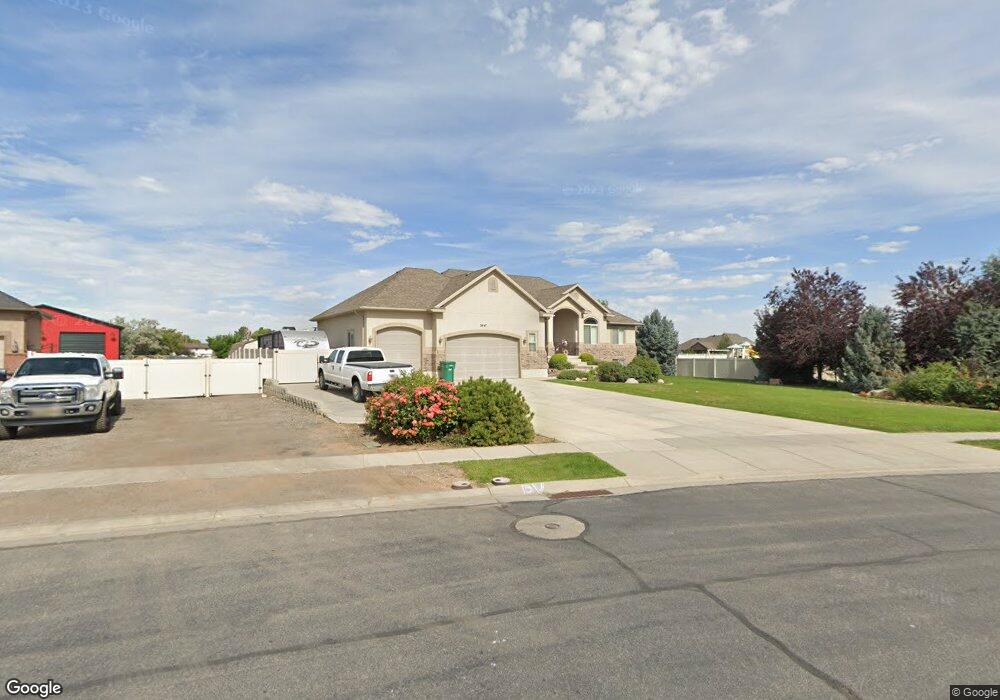
3647 S 4975 W West Haven, UT 84401
Estimated Value: $670,000 - $920,000
4
Beds
3
Baths
3,726
Sq Ft
$210/Sq Ft
Est. Value
About This Home
This home is located at 3647 S 4975 W, West Haven, UT 84401 and is currently estimated at $782,603, approximately $210 per square foot. 3647 S 4975 W is a home located in Weber County with nearby schools including Country View School, Rocky Mountain Junior High School, and Fremont High School.
Ownership History
Date
Name
Owned For
Owner Type
Purchase Details
Closed on
Sep 11, 2008
Sold by
Boss Homes Llc and Cherry Brett
Bought by
Smith Steve D and Smith Cathie L
Current Estimated Value
Home Financials for this Owner
Home Financials are based on the most recent Mortgage that was taken out on this home.
Original Mortgage
$368,600
Interest Rate
6.06%
Mortgage Type
Purchase Money Mortgage
Purchase Details
Closed on
May 21, 2007
Sold by
Haven Estates Llc
Bought by
Boss Homes Llc and Cherry Brett
Purchase Details
Closed on
Jan 1, 2007
Sold by
Haven Estates Llc
Bought by
Boss Homes Llc
Home Financials for this Owner
Home Financials are based on the most recent Mortgage that was taken out on this home.
Original Mortgage
$324,000
Interest Rate
6.11%
Mortgage Type
Construction
Create a Home Valuation Report for This Property
The Home Valuation Report is an in-depth analysis detailing your home's value as well as a comparison with similar homes in the area
Home Values in the Area
Average Home Value in this Area
Purchase History
| Date | Buyer | Sale Price | Title Company |
|---|---|---|---|
| Smith Steve D | -- | Mountain View Title Ogden | |
| Boss Homes Llc | -- | Mountain View Title Ogden | |
| Boss Homes Llc | -- | Mountain View Title Ogden |
Source: Public Records
Mortgage History
| Date | Status | Borrower | Loan Amount |
|---|---|---|---|
| Closed | Smith Steve D | $368,600 | |
| Previous Owner | Boss Homes Llc | $324,000 | |
| Previous Owner | Boss Homes Llc | $324,000 |
Source: Public Records
Tax History Compared to Growth
Tax History
| Year | Tax Paid | Tax Assessment Tax Assessment Total Assessment is a certain percentage of the fair market value that is determined by local assessors to be the total taxable value of land and additions on the property. | Land | Improvement |
|---|---|---|---|---|
| 2025 | $5,036 | $760,953 | $270,868 | $490,085 |
| 2024 | $4,793 | $412,894 | $149,922 | $262,972 |
| 2023 | $4,798 | $419,090 | $147,070 | $272,020 |
| 2022 | $5,041 | $455,761 | $146,530 | $309,231 |
| 2021 | $4,303 | $646,000 | $155,800 | $490,200 |
| 2020 | $3,888 | $541,000 | $135,800 | $405,200 |
| 2019 | $3,672 | $484,000 | $120,900 | $363,100 |
| 2018 | $3,730 | $478,000 | $120,900 | $357,100 |
| 2017 | $3,112 | $382,000 | $92,400 | $289,600 |
| 2016 | $2,743 | $183,265 | $40,088 | $143,177 |
| 2015 | $2,678 | $179,197 | $42,838 | $136,359 |
| 2014 | $2,463 | $159,701 | $40,088 | $119,613 |
Source: Public Records
Map
Nearby Homes
- 3731 S 4975 W
- 4941 W 3575 S
- 3243 S 4950 W Unit 25
- 3263 S 4950 W Unit 24
- 3225 S 4950 W Unit 26
- 3198 S 4950 W Unit 29
- 3192 S 4950 W Unit 28
- 3238 S 4950 W
- 3233 S 4975 W Unit 14
- 3223 S 4975 W Unit 15
- 3257 S 4975 W Unit 12
- 3269 S 4975 W Unit 11
- 3660 S 4700 W
- 4622 W 3725 S Unit 231
- 3690 S 4625 W Unit 228
- 3686 S 4625 W Unit 227
- 3678 S 4625 W Unit 225
- 4618 W 3725 S Unit 233
- 5389 W 3850 S Unit 22
- 5417 W 3850 S
- 3647 S 4975 W Unit 33
- 3225 S 4975 W
- 3287 S 4975 W Unit 10
- 3677 S 4975 W
- 4972 W 3625 S
- 3278 S 4975 W Unit 10
- 4965 W 3625 S
- 3612 S 5100 W
- 4962 W 3625 S
- 3683 S 4975 W
- 3664 S 4975 W
- 3664 S 4975 W Unit 45
- 3664 S 4975 W Unit 44
- 4951 W 3625 S
- 4995 W 3575 S Unit 79
- 4995 W 3575 S
- 3680 S 4975 W
- 3680 S 4975 W Unit 44
- 4954 W 3625 S
- 4954 W 3625 S Unit 36