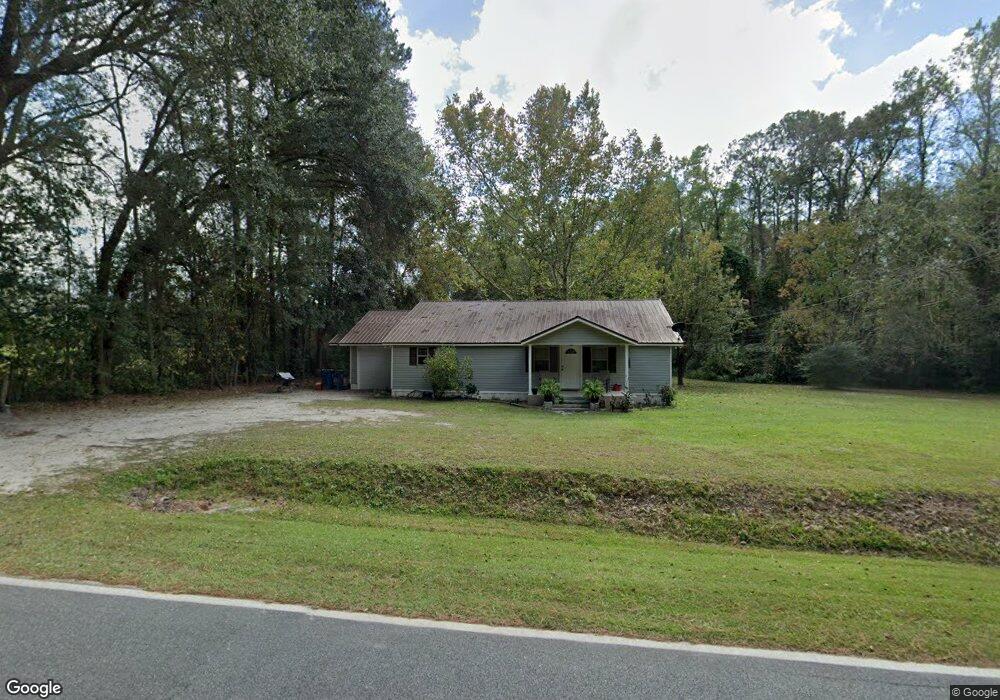
3648 Driggers Rd Waycross, GA 31503
Estimated Value: $220,723 - $245,000
3
Beds
2
Baths
1,702
Sq Ft
$137/Sq Ft
Est. Value
About This Home
This home is located at 3648 Driggers Rd, Waycross, GA 31503 and is currently estimated at $233,181, approximately $137 per square foot. 3648 Driggers Rd is a home located in Ware County with nearby schools including Memorial Drive Elementary School, Waycross Middle School, and Ware County High School.
Ownership History
Date
Name
Owned For
Owner Type
Purchase Details
Closed on
Nov 22, 2022
Sold by
Martin Susan E
Bought by
Pittman Luckie
Current Estimated Value
Purchase Details
Closed on
Jun 17, 2019
Sold by
Sasser Robert A
Bought by
Martin Susan E
Home Financials for this Owner
Home Financials are based on the most recent Mortgage that was taken out on this home.
Original Mortgage
$121,500
Interest Rate
4%
Mortgage Type
New Conventional
Purchase Details
Closed on
Feb 27, 2018
Sold by
Reed Carole English
Bought by
Sasser Robert A
Purchase Details
Closed on
Aug 7, 2013
Sold by
Blount Timothy E
Bought by
Read Carole English
Purchase Details
Closed on
Jun 4, 2013
Sold by
Ali Mohammed W
Bought by
Blount Timothy E
Purchase Details
Closed on
Aug 2, 2012
Sold by
Blount Timothy E
Bought by
Ali Mohammed W
Purchase Details
Closed on
Mar 28, 2003
Sold by
Davis Osborn
Bought by
Cook Raymond O and Blount Timothy E
Create a Home Valuation Report for This Property
The Home Valuation Report is an in-depth analysis detailing your home's value as well as a comparison with similar homes in the area
Home Values in the Area
Average Home Value in this Area
Purchase History
| Date | Buyer | Sale Price | Title Company |
|---|---|---|---|
| Pittman Luckie | -- | -- | |
| Martin Susan E | $128,000 | -- | |
| Sasser Robert A | $80,000 | -- | |
| Read Carole English | $25,000 | -- | |
| Blount Timothy E | -- | -- | |
| Ali Mohammed W | $41,653 | -- | |
| Cook Raymond O | $58,000 | -- |
Source: Public Records
Mortgage History
| Date | Status | Borrower | Loan Amount |
|---|---|---|---|
| Previous Owner | Martin Susan E | $121,500 |
Source: Public Records
Tax History Compared to Growth
Tax History
| Year | Tax Paid | Tax Assessment Tax Assessment Total Assessment is a certain percentage of the fair market value that is determined by local assessors to be the total taxable value of land and additions on the property. | Land | Improvement |
|---|---|---|---|---|
| 2024 | $1,654 | $67,553 | $9,316 | $58,237 |
| 2023 | $1,739 | $45,855 | $4,200 | $41,655 |
| 2022 | $1,074 | $45,855 | $4,200 | $41,655 |
| 2021 | $1,179 | $37,579 | $4,200 | $33,379 |
| 2020 | $1,156 | $36,466 | $4,200 | $32,266 |
| 2019 | $1,035 | $36,466 | $4,200 | $32,266 |
| 2018 | $1,154 | $35,354 | $4,200 | $31,154 |
| 2017 | $882 | $35,354 | $4,200 | $31,154 |
| 2016 | $882 | $27,038 | $4,200 | $22,838 |
| 2015 | $861 | $26,160 | $4,200 | $21,960 |
| 2014 | $270 | $15,180 | $4,200 | $10,980 |
| 2013 | -- | $19,500 | $4,200 | $15,300 |
Source: Public Records
Map
Nearby Homes
- 3817 Central Ave
- 3153 Southwood Dr
- 606 Stonewall Jackson Place
- 664 Saddle Cir
- 630 Saddle Cir
- 627 Saddle Cir
- 1132 Hilltop Rd
- 3070 Central Ave
- 851 Carriage Ln
- 763 Kentland Dr
- 867 Kentland Dr
- 1072 Lawhorne Dr
- Tract 4 County-Line Rd S
- 4155 Pinecrest Rd
- 4337 White Hall Church Rd
- 4337 Whitehall Church Rd
- 723 St Bernard Trail
- 2775 Seminole Trail
- 291 Sawdust Trail
- 1049 Riverdale Dr