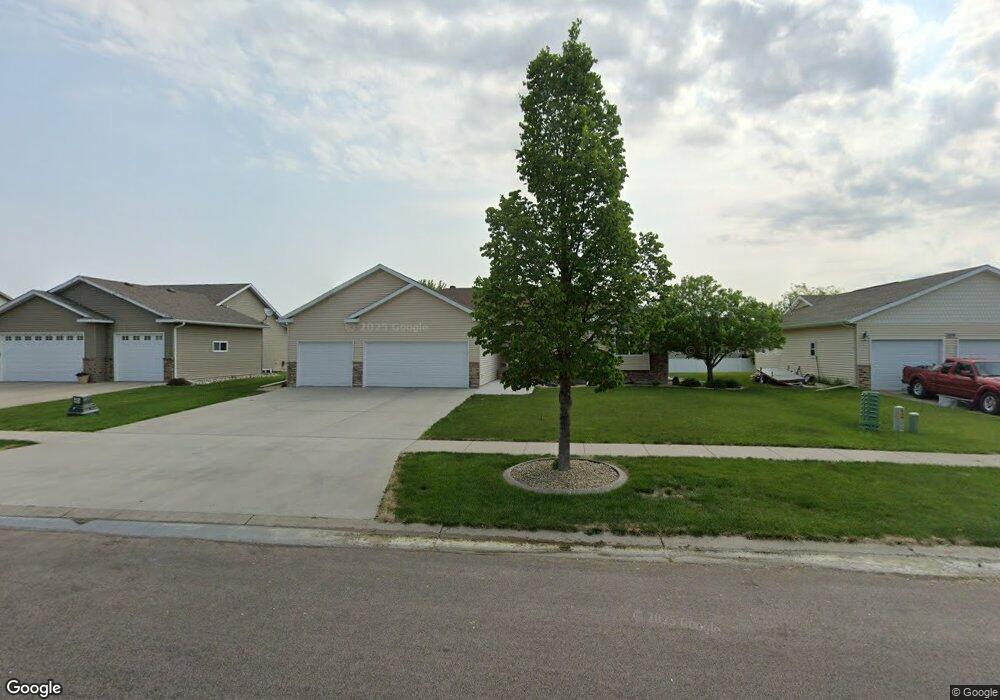
3648 Fillmore St S Fargo, ND 58104
Pointe West NeighborhoodEstimated Value: $423,000 - $445,000
3
Beds
2
Baths
1,616
Sq Ft
$268/Sq Ft
Est. Value
About This Home
This home is located at 3648 Fillmore St S, Fargo, ND 58104 and is currently estimated at $433,462, approximately $268 per square foot. 3648 Fillmore St S is a home located in Cass County with nearby schools including Kennedy Elementary School, Discovery Middle School, and Fargo Davies High School.
Ownership History
Date
Name
Owned For
Owner Type
Purchase Details
Closed on
Jul 9, 2021
Sold by
Eagleson Jayla R and Eagleson Ryan M
Bought by
Eagleson Jayla E and Eagleson Ryan M
Current Estimated Value
Home Financials for this Owner
Home Financials are based on the most recent Mortgage that was taken out on this home.
Original Mortgage
$131,300
Outstanding Balance
$100,349
Interest Rate
2.9%
Mortgage Type
New Conventional
Estimated Equity
$333,113
Purchase Details
Closed on
Jan 22, 2014
Sold by
Wheeldon Samuel J
Bought by
Wheeldon Jayla R
Purchase Details
Closed on
May 19, 2008
Sold by
Kreuger Construction Inc
Bought by
Wheeldon Samuel J and Wheeldon Jayla R
Home Financials for this Owner
Home Financials are based on the most recent Mortgage that was taken out on this home.
Original Mortgage
$183,750
Interest Rate
5.93%
Mortgage Type
New Conventional
Purchase Details
Closed on
Oct 24, 2007
Sold by
Matrix Properties Corp
Bought by
Krueger Construction Inc
Home Financials for this Owner
Home Financials are based on the most recent Mortgage that was taken out on this home.
Original Mortgage
$153,900
Interest Rate
6.33%
Mortgage Type
Construction
Create a Home Valuation Report for This Property
The Home Valuation Report is an in-depth analysis detailing your home's value as well as a comparison with similar homes in the area
Home Values in the Area
Average Home Value in this Area
Purchase History
| Date | Buyer | Sale Price | Title Company |
|---|---|---|---|
| Eagleson Jayla E | -- | The Title Co Residential | |
| Wheeldon Jayla R | -- | None Available | |
| Wheeldon Samuel J | -- | -- | |
| Krueger Construction Inc | -- | -- |
Source: Public Records
Mortgage History
| Date | Status | Borrower | Loan Amount |
|---|---|---|---|
| Open | Eagleson Jayla E | $131,300 | |
| Closed | Wheeldon Samuel J | $183,750 | |
| Previous Owner | Krueger Construction Inc | $153,900 |
Source: Public Records
Tax History Compared to Growth
Tax History
| Year | Tax Paid | Tax Assessment Tax Assessment Total Assessment is a certain percentage of the fair market value that is determined by local assessors to be the total taxable value of land and additions on the property. | Land | Improvement |
|---|---|---|---|---|
| 2024 | $7,223 | $213,800 | $36,700 | $177,100 |
| 2023 | $7,380 | $203,000 | $38,300 | $164,700 |
| 2022 | $6,979 | $184,550 | $38,300 | $146,250 |
| 2021 | $6,766 | $178,300 | $38,300 | $140,000 |
| 2020 | $6,419 | $166,650 | $38,300 | $128,350 |
| 2019 | $6,424 | $166,650 | $23,950 | $142,700 |
| 2018 | $6,363 | $166,650 | $23,950 | $142,700 |
| 2017 | $6,195 | $161,650 | $23,950 | $137,700 |
| 2016 | $5,505 | $146,950 | $23,950 | $123,000 |
| 2015 | $5,726 | $146,950 | $16,300 | $130,650 |
| 2014 | $5,510 | $136,100 | $16,300 | $119,800 |
| 2013 | $5,360 | $129,600 | $16,300 | $113,300 |
Source: Public Records
Map
Nearby Homes
- 4216 34th Ave S
- 4306 39th Ave S
- 4293 39 1 2 Ave S
- 4318 39 1 2 Ave S
- 4276 39 1 2 Ave S
- 4274 39 1 2 Ave S
- 4245 Coventry Dr S
- 3606 Decorah Way S
- 3630 Decorah Way S
- 3624 Decorah Way
- 4176 Arthur Dr
- 3612 Decorah Way S
- 4168 Arthur Dr
- 4801 Decorah Way S
- 1665 3-Stall Plan at The Residence at Valley View Estates
- 4824 Decorah Way S
- 4150 Arthur Dr
- 4106 Arthur Dr
- 4849 Decorah Way S
- 3712 49th St S
- 3642 Fillmore St S
- 3656 Fillmore St S
- 3643 Taylor St S
- 3633 Taylor St S
- 3651 Taylor St S
- 3636 Fillmore St S
- 3662 Fillmore St S
- 3657 Fillmore St S
- 3649 Fillmore St S
- 3665 Fillmore St S
- 3641 Fillmore St S
- 3628 Fillmore St S
- 3678 Fillmore St S
- 3669 Taylor St S
- 3626 Fillmore St S
- 3673 Fillmore St S
- 3635 Fillmore St S
- 3617 Taylor St S
- 3633 Fillmore St S
- 3618 Fillmore St S