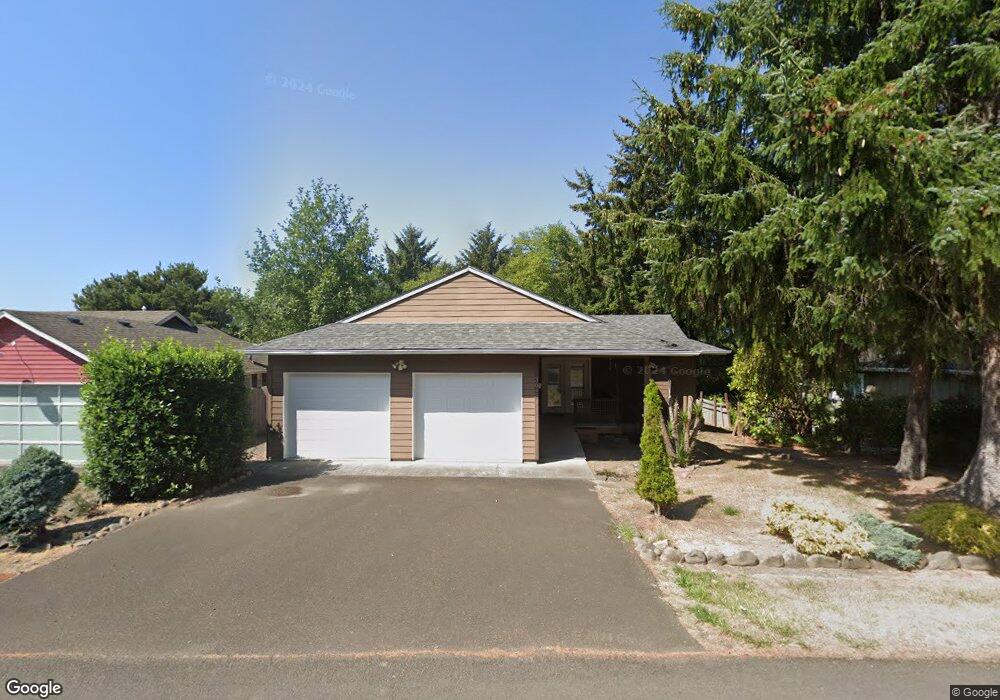
3648 W Chinook Cannon Beach, OR 97110
Estimated Value: $512,000 - $952,000
3
Beds
2
Baths
2,078
Sq Ft
$351/Sq Ft
Est. Value
About This Home
This home is located at 3648 W Chinook, Cannon Beach, OR 97110 and is currently estimated at $730,007, approximately $351 per square foot. 3648 W Chinook is a home located in Clatsop County with nearby schools including Seaside High School and The Cannon Beach Academy.
Ownership History
Date
Name
Owned For
Owner Type
Purchase Details
Closed on
Jul 15, 2024
Sold by
Coleman Sandy and Coleman Steven R
Bought by
Steven And Sandra Coleman Joint Revocable Liv and Coleman
Current Estimated Value
Purchase Details
Closed on
Feb 13, 2018
Sold by
Bergin Thomas J
Bought by
Coleman Steven R and Coleman Sandy J
Purchase Details
Closed on
Aug 8, 2017
Sold by
Eayds Michael and Eayds Trina
Bought by
Coleman Steven R and Coleman Sandy J
Purchase Details
Closed on
Oct 15, 2010
Sold by
Citibank N A
Bought by
Eayds Michael and Eayds Trina
Home Financials for this Owner
Home Financials are based on the most recent Mortgage that was taken out on this home.
Original Mortgage
$261,478
Interest Rate
4.5%
Mortgage Type
FHA
Purchase Details
Closed on
Nov 24, 2009
Sold by
Saucedo Benjamin P and Saucedo Linda B
Bought by
Citibank Na
Create a Home Valuation Report for This Property
The Home Valuation Report is an in-depth analysis detailing your home's value as well as a comparison with similar homes in the area
Home Values in the Area
Average Home Value in this Area
Purchase History
| Date | Buyer | Sale Price | Title Company |
|---|---|---|---|
| Steven And Sandra Coleman Joint Revocable Liv | -- | None Listed On Document | |
| Coleman Steven R | $242,881 | None Available | |
| Coleman Steven R | $242,881 | None Available | |
| Eayds Michael | $265,000 | Multiple | |
| Citibank Na | $313,579 | Fidelity |
Source: Public Records
Mortgage History
| Date | Status | Borrower | Loan Amount |
|---|---|---|---|
| Previous Owner | Eayds Michael | $261,478 |
Source: Public Records
Tax History Compared to Growth
Tax History
| Year | Tax Paid | Tax Assessment Tax Assessment Total Assessment is a certain percentage of the fair market value that is determined by local assessors to be the total taxable value of land and additions on the property. | Land | Improvement |
|---|---|---|---|---|
| 2024 | $4,286 | $339,575 | -- | -- |
| 2023 | $3,873 | $329,685 | $0 | $0 |
| 2022 | $3,772 | $320,084 | $0 | $0 |
| 2021 | $3,695 | $310,763 | $0 | $0 |
| 2020 | $3,575 | $301,712 | $0 | $0 |
| 2019 | $3,203 | $292,925 | $0 | $0 |
| 2018 | $3,086 | $284,394 | $0 | $0 |
| 2017 | $2,631 | $253,214 | $0 | $0 |
| 2016 | $2,317 | $254,354 | $96,994 | $157,360 |
| 2015 | $2,081 | $231,317 | $96,994 | $134,323 |
| 2014 | $2,537 | $276,111 | $0 | $0 |
| 2013 | -- | $268,070 | $0 | $0 |
Source: Public Records
Map
Nearby Homes
- 3664 W Chinook Ave
- 315 N Chinook St
- 3732 Coho Place
- VL S
- 3772 W Chinook Ave
- 0
- 3524 Pacific
- 0 Ocean Ave Unit 25-686
- 0 Ocean Ave Unit 402119772
- 2657 N Highway 101
- 0 Lodges at Cannon Beach Unit 25-159
- 132 E Surfcrest Ave
- 4072 S Hemlock St
- 223 W Kenai St
- 159 W Nelchena St
- 116 W Watts Way
- 131 W Nebesna
- 4463 Pacific Ave
- 143 W Tanana Ave
- 163 Amber Ln
- 0 W Chinook Ave
- 3649 W Chinook Ave
- 3608 W Chinook Ave
- 3631 W Chinook Ave
- 3680 W Chinook Ave
- 3663 W Chinook Ave
- 3548 W Chinook Ave
- 3716 W Chinook Ave
- 308 Elk Run Ave
- 3540 W Chinook Ave
- 323 N Chinook St
- 315 Elk Run
- 323 N Chinook
- 3724 W Chinook Ave
- 324 Elk Run Ave
- 347 Elk Run Ave
- 3532 W Chinook Ave
- 3732 W Chinook
- 331 N Chinook St
- 3731 W Chinook Ave