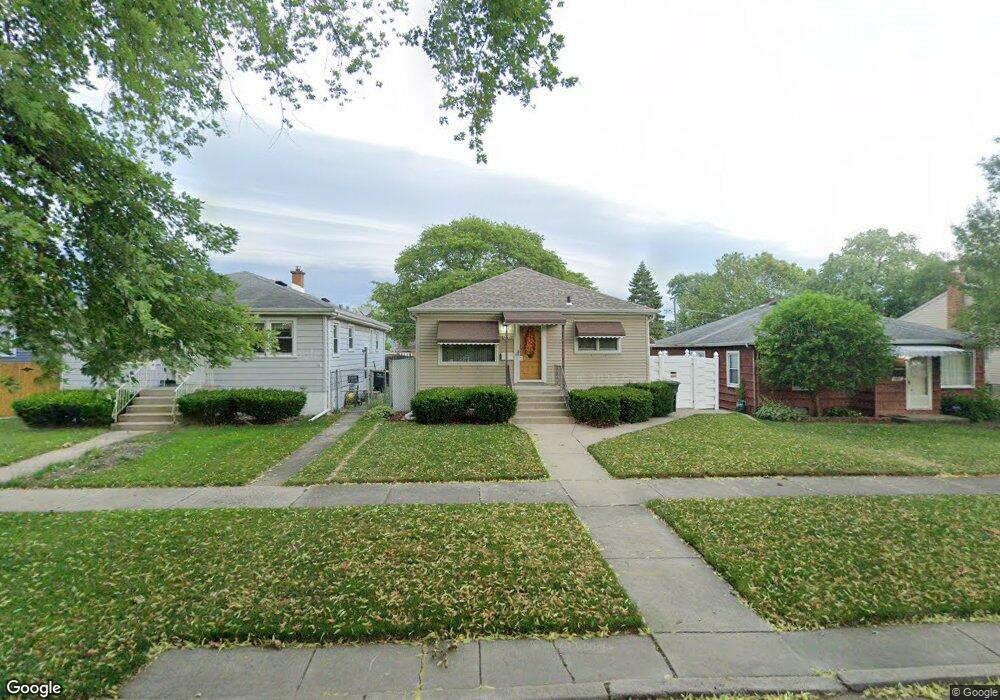
3648 Washington St Lansing, IL 60438
Estimated Value: $173,402 - $208,000
4
Beds
2
Baths
1,040
Sq Ft
$184/Sq Ft
Est. Value
About This Home
This home is located at 3648 Washington St, Lansing, IL 60438 and is currently estimated at $191,601, approximately $184 per square foot. 3648 Washington St is a home located in Cook County with nearby schools including Coolidge Elementary School, Memorial Jr High School, and Thornton Fractnl So High School.
Ownership History
Date
Name
Owned For
Owner Type
Purchase Details
Closed on
Jan 14, 2020
Sold by
The Chicago Trust Company N A
Bought by
Zaba Edouard and Zaba Marianne
Current Estimated Value
Purchase Details
Closed on
Aug 22, 2016
Sold by
Zaba Eduard and Zaba Marianne
Bought by
The Chicago Trust Company Na and Trust Number Bev4116
Purchase Details
Closed on
May 25, 2005
Sold by
Zaba Edward and Zaba Marianne C
Bought by
Zaba Edward and Zaba Marianne C
Home Financials for this Owner
Home Financials are based on the most recent Mortgage that was taken out on this home.
Original Mortgage
$170,000
Interest Rate
5.82%
Mortgage Type
New Conventional
Purchase Details
Closed on
May 8, 1999
Sold by
Zaba Edward and Zaba Marianne C
Bought by
Zaba Edward and Zaba Marianne C
Create a Home Valuation Report for This Property
The Home Valuation Report is an in-depth analysis detailing your home's value as well as a comparison with similar homes in the area
Home Values in the Area
Average Home Value in this Area
Purchase History
| Date | Buyer | Sale Price | Title Company |
|---|---|---|---|
| Zaba Edouard | -- | None Available | |
| The Chicago Trust Company Na | -- | Attorney | |
| Zaba Edward | -- | Archer Land Title Inc | |
| Zaba Edward | -- | -- |
Source: Public Records
Mortgage History
| Date | Status | Borrower | Loan Amount |
|---|---|---|---|
| Previous Owner | Zaba Edward | $170,000 |
Source: Public Records
Tax History Compared to Growth
Tax History
| Year | Tax Paid | Tax Assessment Tax Assessment Total Assessment is a certain percentage of the fair market value that is determined by local assessors to be the total taxable value of land and additions on the property. | Land | Improvement |
|---|---|---|---|---|
| 2024 | $960 | $13,200 | $2,278 | $10,922 |
| 2023 | $1,331 | $13,200 | $2,278 | $10,922 |
| 2022 | $1,331 | $9,399 | $2,010 | $7,389 |
| 2021 | $2,152 | $9,399 | $2,010 | $7,389 |
| 2020 | $2,238 | $9,399 | $2,010 | $7,389 |
| 2019 | $2,083 | $9,831 | $1,876 | $7,955 |
| 2018 | $2,038 | $9,831 | $1,876 | $7,955 |
| 2017 | $1,140 | $9,831 | $1,876 | $7,955 |
| 2016 | $2,574 | $8,989 | $1,742 | $7,247 |
| 2015 | $2,282 | $8,989 | $1,742 | $7,247 |
| 2014 | $2,298 | $8,989 | $1,742 | $7,247 |
| 2013 | $2,540 | $10,149 | $1,742 | $8,407 |
Source: Public Records
Map
Nearby Homes
- 17945 Maple St
- 17922 State Line Ave
- 7937 Forest Ave
- 108 Beverly Place
- 8019 Hohman Ave
- 3627 Ridge Rd
- 3423 Adams St
- 18215 Wentworth Ave Unit 3B
- 8130 Meadow Ln
- 17706 Wentworth Ave
- 18333 Wentworth Ave Unit 7
- 17702 Bernadine St
- 18358 Willow Ln
- 17946 Roy St
- 18405 Wentworth Ave Unit 1D
- 17926 Roy St
- 3336 178th St
- 18316 Sherman St
- 18416 Willow Ln
- 7624 Forest Ave
- 3644 Washington St
- 3652 Washington St
- 3640 Washington St
- 3656 Washington St
- 3636 Washington St
- 3660 Washington St
- 3647 Madison St
- 3651 Madison St
- 3643 Madison St
- 3632 Washington St
- 3664 Washington St
- 3655 Madison St
- 3639 Madison St
- 3659 Madison St
- 3635 Madison St
- 3628 Washington St
- 3668 Washington St
- 3647 Washington St
- 3651 Washington St
- 18041 Lange St