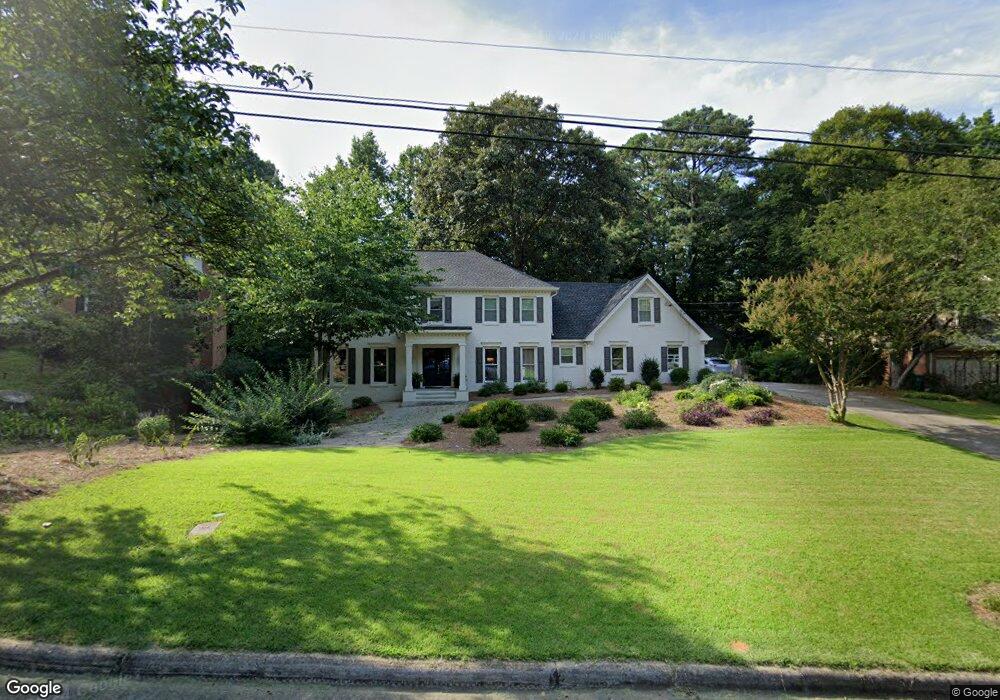
3649 Allenhurst Dr Unit 3 Norcross, GA 30092
Estimated Value: $673,000 - $786,000
4
Beds
3
Baths
2,695
Sq Ft
$273/Sq Ft
Est. Value
About This Home
This home is located at 3649 Allenhurst Dr Unit 3, Norcross, GA 30092 and is currently estimated at $734,712, approximately $272 per square foot. 3649 Allenhurst Dr Unit 3 is a home located in Gwinnett County with nearby schools including Simpson Elementary School, Pinckneyville Middle School, and Norcross High School.
Ownership History
Date
Name
Owned For
Owner Type
Purchase Details
Closed on
Jul 15, 2016
Sold by
Bell David C and Bell Kristine K
Bought by
Samples Sydney P and Samples Julie P
Current Estimated Value
Home Financials for this Owner
Home Financials are based on the most recent Mortgage that was taken out on this home.
Original Mortgage
$400,000
Interest Rate
3.54%
Mortgage Type
New Conventional
Purchase Details
Closed on
Apr 21, 2000
Sold by
Gillenwater James M
Bought by
Bell David C and Bell Kristen K
Home Financials for this Owner
Home Financials are based on the most recent Mortgage that was taken out on this home.
Original Mortgage
$245,600
Interest Rate
7.63%
Mortgage Type
New Conventional
Purchase Details
Closed on
Jul 20, 1995
Sold by
Wallace Joyce E
Bought by
Gillenwater James M
Create a Home Valuation Report for This Property
The Home Valuation Report is an in-depth analysis detailing your home's value as well as a comparison with similar homes in the area
Home Values in the Area
Average Home Value in this Area
Purchase History
| Date | Buyer | Sale Price | Title Company |
|---|---|---|---|
| Samples Sydney P | $375,000 | -- | |
| Bell David C | $307,000 | -- | |
| Gillenwater James M | $206,000 | -- |
Source: Public Records
Mortgage History
| Date | Status | Borrower | Loan Amount |
|---|---|---|---|
| Closed | Samples Sydney P | $400,000 | |
| Previous Owner | Bell David C | $245,600 | |
| Closed | Gillenwater James M | $0 |
Source: Public Records
Tax History Compared to Growth
Tax History
| Year | Tax Paid | Tax Assessment Tax Assessment Total Assessment is a certain percentage of the fair market value that is determined by local assessors to be the total taxable value of land and additions on the property. | Land | Improvement |
|---|---|---|---|---|
| 2025 | $2,401 | $278,960 | $50,160 | $228,800 |
| 2024 | $7,373 | $245,280 | $50,400 | $194,880 |
| 2023 | $7,373 | $214,520 | $44,000 | $170,520 |
| 2022 | $6,275 | $191,520 | $36,000 | $155,520 |
| 2021 | $5,752 | $161,120 | $35,520 | $125,600 |
| 2020 | $5,787 | $161,120 | $35,520 | $125,600 |
| 2019 | $5,363 | $150,680 | $30,000 | $120,680 |
| 2018 | $5,379 | $150,680 | $30,000 | $120,680 |
| 2016 | $4,131 | $130,080 | $24,000 | $106,080 |
| 2015 | $4,171 | $130,080 | $24,000 | $106,080 |
| 2014 | $4,053 | $130,080 | $24,000 | $106,080 |
Source: Public Records
Map
Nearby Homes
- 5649 Whitesburg Ct
- 5786 Broxton Cir
- 4102 Ailey Ct
- 3962 Gunnin Rd
- 3723 Orchard St
- 4570 Waterside Pkwy
- 4053 Spalding Hollow NW
- 3370 Oak Harbor Dr
- 6027 Peachmont Terrace
- 3922 Glen Meadow Dr
- 5885 Match Point
- 3553 Corners Way
- 3910 Spalding Bluff Dr
- 507 Peachtree Forest Terrace
- 4944 Sealy Cir
- 4965 Sealy Cir
- 601 Peachtree Forest Ave
- 3659 Allenhurst Dr
- 3639 Allenhurst Dr
- 5672 Bloomingdale Ct
- 5662 Bloomingdale Ct
- 3669 Allenhurst Dr Unit 3
- 3648 Allenhurst Dr
- 3638 Allenhurst Dr Unit 3
- 3629 Allenhurst Dr Unit 3
- 5682 Bloomingdale Ct
- 3658 Allenhurst Dr
- 5652 Bloomingdale Ct
- 5652 Bloomingdale Ct Unit 2
- 0 Bloomingdale Ct NW Unit 8749074
- 0 Bloomingdale Ct NW Unit 8731298
- 0 Bloomingdale Ct NW Unit 8550081
- 0 Bloomingdale Ct NW Unit 7549977
- 0 Bloomingdale Ct NW
- 5692 Bloomingdale Ct
- 3678 Allenhurst Dr
- 3618 Allenhurst Dr