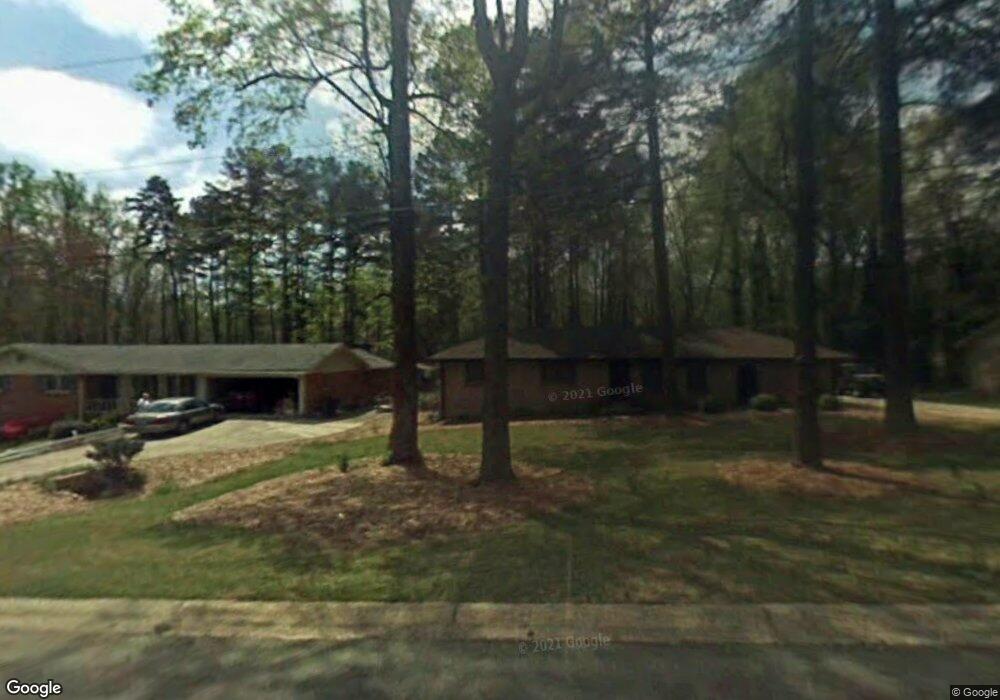
365 Arcadia Place SW Unit 6 Lilburn, GA 30047
Estimated Value: $303,000 - $337,000
3
Beds
2
Baths
1,296
Sq Ft
$250/Sq Ft
Est. Value
About This Home
This home is located at 365 Arcadia Place SW Unit 6, Lilburn, GA 30047 and is currently estimated at $324,476, approximately $250 per square foot. 365 Arcadia Place SW Unit 6 is a home located in Gwinnett County with nearby schools including Camp Creek Elementary School, Trickum Middle School, and Parkview High School.
Ownership History
Date
Name
Owned For
Owner Type
Purchase Details
Closed on
Mar 12, 2021
Sold by
Tobar Enterprises Inc
Bought by
Mouchabeck Andrew and Morales Alexis
Current Estimated Value
Home Financials for this Owner
Home Financials are based on the most recent Mortgage that was taken out on this home.
Original Mortgage
$244,900
Outstanding Balance
$218,651
Interest Rate
2.73%
Mortgage Type
New Conventional
Estimated Equity
$105,825
Purchase Details
Closed on
Sep 30, 2020
Sold by
Falcon Mutual Llc
Bought by
Tobar Enterprises Inc
Purchase Details
Closed on
Sep 21, 1994
Sold by
Rawlinson Catherine A
Bought by
Shapiro Michael Patti Jo
Home Financials for this Owner
Home Financials are based on the most recent Mortgage that was taken out on this home.
Original Mortgage
$53,800
Interest Rate
8.56%
Create a Home Valuation Report for This Property
The Home Valuation Report is an in-depth analysis detailing your home's value as well as a comparison with similar homes in the area
Home Values in the Area
Average Home Value in this Area
Purchase History
| Date | Buyer | Sale Price | Title Company |
|---|---|---|---|
| Mouchabeck Andrew | $259,900 | -- | |
| Tobar Enterprises Inc | $165,000 | -- | |
| Falcon Mutual Llc | $140,000 | -- | |
| Shapiro Michael Patti Jo | $76,900 | -- |
Source: Public Records
Mortgage History
| Date | Status | Borrower | Loan Amount |
|---|---|---|---|
| Open | Mouchabeck Andrew | $244,900 | |
| Previous Owner | Shapiro Michael Patti Jo | $53,800 |
Source: Public Records
Tax History Compared to Growth
Tax History
| Year | Tax Paid | Tax Assessment Tax Assessment Total Assessment is a certain percentage of the fair market value that is determined by local assessors to be the total taxable value of land and additions on the property. | Land | Improvement |
|---|---|---|---|---|
| 2025 | $3,568 | $124,240 | $22,200 | $102,040 |
| 2024 | $3,702 | $124,760 | $22,200 | $102,560 |
| 2023 | $3,702 | $116,560 | $27,200 | $89,360 |
| 2022 | $3,145 | $99,640 | $19,600 | $80,040 |
| 2021 | $2,642 | $63,520 | $19,600 | $43,920 |
| 2020 | $2,410 | $56,760 | $15,600 | $41,160 |
| 2019 | $2,163 | $52,160 | $15,600 | $36,560 |
| 2018 | $2,041 | $48,760 | $13,200 | $35,560 |
| 2016 | $1,678 | $37,880 | $9,600 | $28,280 |
| 2015 | $1,657 | $36,880 | $8,000 | $28,880 |
| 2014 | -- | $28,000 | $9,440 | $18,560 |
Source: Public Records
Map
Nearby Homes
- Oxford Plan at The Preserve at Killian Hill - Townhomes
- 4358 Louis Rd SW
- 383 Ben Ave SW
- 146 King David Dr SW
- 4406 Hale Dr SW
- 4567 Town Crier Rd SW
- 551 Killian Hill Rd SW
- 4627 Nantucket Dr SW
- 246 Round Pond Dr
- 4239 River Branch Way
- 478 Dorsey Cir SW
- 445 Bruce Way SW
- 156 Round Pond Dr
- 311 Arbor Point Ct SW
- 4582 Warrior Trail SW
- 562 Gregg Dr SW
- 4704 Arrowhead Trail SW
- 365 Arcadia Place SW
- 379 Arcadia Place SW
- 375 Arcadia Place SW
- 355 Arcadia Place SW
- 0 Arcadia Place SW Unit 8689131
- 0 Arcadia Place SW Unit 3273758
- 0 Arcadia Place SW Unit 8874335
- 0 Arcadia Place SW Unit 6808918
- 0 Arcadia Place SW Unit 7021704
- 0 Arcadia Place SW Unit 7111553
- 0 Arcadia Place SW Unit 7156386
- 0 Arcadia Place SW Unit 7167908
- 0 Arcadia Place SW Unit 7499566
- 0 Arcadia Place SW Unit 8613815
- 0 Arcadia Place SW Unit 8661261
- 345 Arcadia Place SW
- 385 Arcadia Place SW Unit 2
- 4544 Arcado Rd SW
- 4502 Bryant Dr SW
- 376 Arcadia Place SW