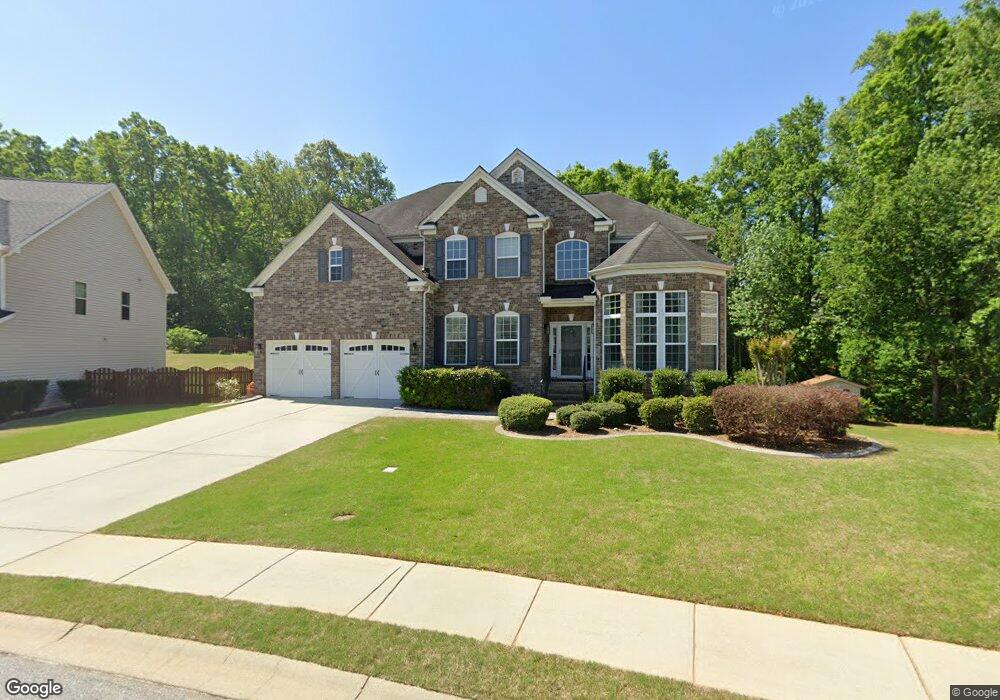
365 Heritage Point Dr Unit HP061 Simpsonville, SC 29681
Estimated Value: $526,000 - $655,000
4
Beds
4
Baths
3,681
Sq Ft
$156/Sq Ft
Est. Value
About This Home
This home is located at 365 Heritage Point Dr Unit HP061, Simpsonville, SC 29681 and is currently estimated at $575,574, approximately $156 per square foot. 365 Heritage Point Dr Unit HP061 is a home located in Greenville County with nearby schools including Bryson Elementary School, Bryson Middle School, and Hillcrest High School.
Ownership History
Date
Name
Owned For
Owner Type
Purchase Details
Closed on
Dec 1, 2022
Sold by
Render Mark C
Bought by
Mark C Render Living Trust
Current Estimated Value
Purchase Details
Closed on
May 4, 2021
Sold by
Render Robin M
Bought by
Render Mark C
Purchase Details
Closed on
Dec 22, 2008
Sold by
Render Mark C and Render Robin M
Bought by
Render Mark C and Render Robin M
Purchase Details
Closed on
Sep 26, 2008
Sold by
Mccar Homes Greenville Llc
Bought by
Render Mark C and Render Robin M
Home Financials for this Owner
Home Financials are based on the most recent Mortgage that was taken out on this home.
Original Mortgage
$300,000
Interest Rate
6.49%
Mortgage Type
Purchase Money Mortgage
Purchase Details
Closed on
Jun 16, 2008
Sold by
Heritage Park Investments Group Llc
Bought by
Mccar Homes Greenville Llc
Create a Home Valuation Report for This Property
The Home Valuation Report is an in-depth analysis detailing your home's value as well as a comparison with similar homes in the area
Home Values in the Area
Average Home Value in this Area
Purchase History
| Date | Buyer | Sale Price | Title Company |
|---|---|---|---|
| Mark C Render Living Trust | -- | -- | |
| Render Mark C | -- | None Available | |
| Render Mark C | -- | -- | |
| Render Mark C | $383,613 | -- | |
| Mccar Homes Greenville Llc | $42,180 | -- |
Source: Public Records
Mortgage History
| Date | Status | Borrower | Loan Amount |
|---|---|---|---|
| Previous Owner | Render Mark C | $300,000 |
Source: Public Records
Tax History Compared to Growth
Tax History
| Year | Tax Paid | Tax Assessment Tax Assessment Total Assessment is a certain percentage of the fair market value that is determined by local assessors to be the total taxable value of land and additions on the property. | Land | Improvement |
|---|---|---|---|---|
| 2024 | $2,733 | $14,190 | $1,600 | $12,590 |
| 2023 | $2,733 | $14,190 | $1,600 | $12,590 |
| 2022 | $2,667 | $14,190 | $1,600 | $12,590 |
| 2021 | $2,669 | $14,190 | $1,600 | $12,590 |
| 2020 | $2,808 | $14,180 | $1,400 | $12,780 |
| 2019 | $2,810 | $14,180 | $1,400 | $12,780 |
| 2018 | $2,671 | $14,180 | $1,400 | $12,780 |
| 2017 | $2,671 | $14,180 | $1,400 | $12,780 |
| 2016 | $2,581 | $354,580 | $35,000 | $319,580 |
| 2015 | $2,581 | $354,580 | $35,000 | $319,580 |
| 2014 | $2,529 | $353,180 | $44,000 | $309,180 |
Source: Public Records
Map
Nearby Homes
- 377 Heritage Point Dr
- 1024 Powderhorn Rd
- 214 Appomattox Dr
- 157 Heritage Point Dr
- 251 Oak Branch Dr
- 14 Corsica Ct
- 415 Raleighwood Ln
- 33 Golden Acre Ct
- 8 Valeria Place
- 106 Ashborne Ln
- 103 Silver Falls Dr
- 6 Ashborne Ln
- 222 Raleighwood Ln
- 18 Gressette Place
- 167 Strongridge Trail
- 210 Nicolet Dr
- 214 Nicolet Dr
- 14 Gressette Place
- 10 Gressette Place
- 206 Nicolet Dr
- 365 Heritage Point Dr
- 361 Heritage Point Dr
- 369 Heritage Point Dr
- 368 Heritage Point Dr
- 357 Heritage Point Dr Unit HP059
- 357 Heritage Point Dr
- 373 Heritage Point Dr
- 348 Heritage Point Dr
- 372 Heritage Point Dr
- 377 Heritage Point Dr Unit Home Site 64
- 353 Heritage Point Dr Unit HP058
- 353 Heritage Point Dr
- 208 Heritage Point Dr
- 204 Heritage Point Dr
- 216 Heritage Point Dr
- 212 Heritage Point Dr
- 340 Heritage Point Dr
- 200 Heritage Point Dr
- 376 Heritage Point Dr
- 381 Heritage Point Dr