Estimated Value: $108,845 - $132,000
3
Beds
1
Bath
1,300
Sq Ft
$91/Sq Ft
Est. Value
About This Home
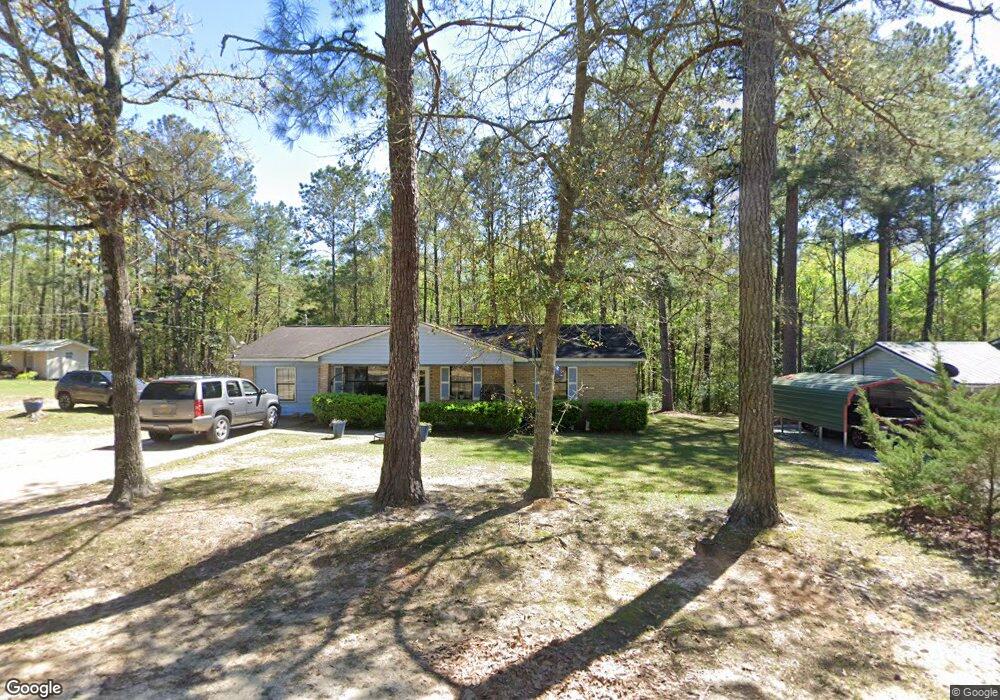
This home is located at 365 Humble Ave SW, Cairo, GA 39828 and is currently estimated at $118,211, approximately $90 per square foot. 365 Humble Ave SW is a home located in Grady County with nearby schools including Cairo High School.
Ownership History
Date
Name
Owned For
Owner Type
Purchase Details
Closed on
Sep 15, 2014
Sold by
Longhorn Llc
Bought by
Ash Diamond and Davis Paul
Current Estimated Value
Home Financials for this Owner
Home Financials are based on the most recent Mortgage that was taken out on this home.
Original Mortgage
$315,000
Interest Rate
4.17%
Mortgage Type
New Conventional
Purchase Details
Closed on
Jan 31, 2011
Bought by
Longhorn Llc
Purchase Details
Closed on
Dec 20, 2010
Sold by
Farmers & Merchants Bank
Bought by
Harris Willie C
Purchase Details
Closed on
Oct 5, 2010
Sold by
Rocuant Albert
Bought by
Farmers & Merchants Bank
Purchase Details
Closed on
Jun 5, 2007
Sold by
Usda Rural Development
Bought by
Rocuant Albert
Purchase Details
Closed on
Oct 21, 1998
Sold by
Williams Lee H
Bought by
Addison Pamela D
Purchase Details
Closed on
Oct 7, 1997
Sold by
Bogan Avis L
Bought by
Williams Lee H
Purchase Details
Closed on
Aug 13, 1993
Bought by
Bogan Avis L
Create a Home Valuation Report for This Property
The Home Valuation Report is an in-depth analysis detailing your home's value as well as a comparison with similar homes in the area
Home Values in the Area
Average Home Value in this Area
Purchase History
| Date | Buyer | Sale Price | Title Company |
|---|---|---|---|
| Ash Diamond | $35,000 | -- | |
| Longhorn Llc | -- | -- | |
| Harris Willie C | $35,000 | -- | |
| Farmers & Merchants Bank | -- | -- | |
| Rocuant Albert | $56,375 | -- | |
| Addison Pamela D | $55,000 | -- | |
| Williams Lee H | -- | -- | |
| Bogan Avis L | $45,000 | -- |
Source: Public Records
Mortgage History
| Date | Status | Borrower | Loan Amount |
|---|---|---|---|
| Closed | Ash Diamond | $315,000 |
Source: Public Records
Tax History Compared to Growth
Tax History
| Year | Tax Paid | Tax Assessment Tax Assessment Total Assessment is a certain percentage of the fair market value that is determined by local assessors to be the total taxable value of land and additions on the property. | Land | Improvement |
|---|---|---|---|---|
| 2024 | $1,643 | $43,200 | $5,200 | $38,000 |
| 2023 | $796 | $23,158 | $2,800 | $20,358 |
| 2022 | $830 | $23,158 | $2,800 | $20,358 |
| 2021 | $832 | $23,158 | $2,800 | $20,358 |
| 2020 | $834 | $23,158 | $2,800 | $20,358 |
| 2019 | $834 | $23,158 | $2,800 | $20,358 |
| 2018 | $794 | $23,158 | $2,800 | $20,358 |
| 2017 | $764 | $23,158 | $2,800 | $20,358 |
| 2016 | $669 | $20,026 | $2,800 | $17,226 |
| 2015 | $501 | $25,768 | $2,800 | $22,968 |
| 2014 | -- | $25,768 | $2,800 | $22,968 |
| 2013 | -- | $22,766 | $2,800 | $19,966 |
Source: Public Records
Map
Nearby Homes
- 109 Oriac Ave SW
- 117 Pine Cir SW
- 786 Madison Ln
- 112 Pine Cir SW
- 75 14th Ave SE
- 1193 S Broad St
- 720 1st St SW
- 270 Muggridge Ln
- 130 17th Ave SE
- 460 2nd St SW
- 27 6th Ave SW
- 425 8th St SW
- 40 5th Ave SW
- 198 Oakdale Rd SE
- 490 13th St SW
- 000 Hwy 111 South 20 59 Acres
- 7501 111 S
- 1310 Stone Ave
- 000 S Broad St
- 1406 Platt Ave
- 385 Humble Ave SW
- 325 Humble Ave SW
- 380 Humble Ave SW
- 340 Humble Ave SW
- 1430 Peace St
- 1428 Peace St
- 320 Humble Ave SW
- 355 Humble Ave SW
- 1422 Peace St
- 395 Mild Ave SW
- 310 Humble Ave SW
- 365 Mild Ave SW
- 1501 Rest St SW
- 1509 Rest St SW
- 1410 Peace St
- 301 Mild Ave SW
- 1423 Rest St SW
- 341 13th Ave SW
- 1411 Rest St SW
- 1407 Rest St SW