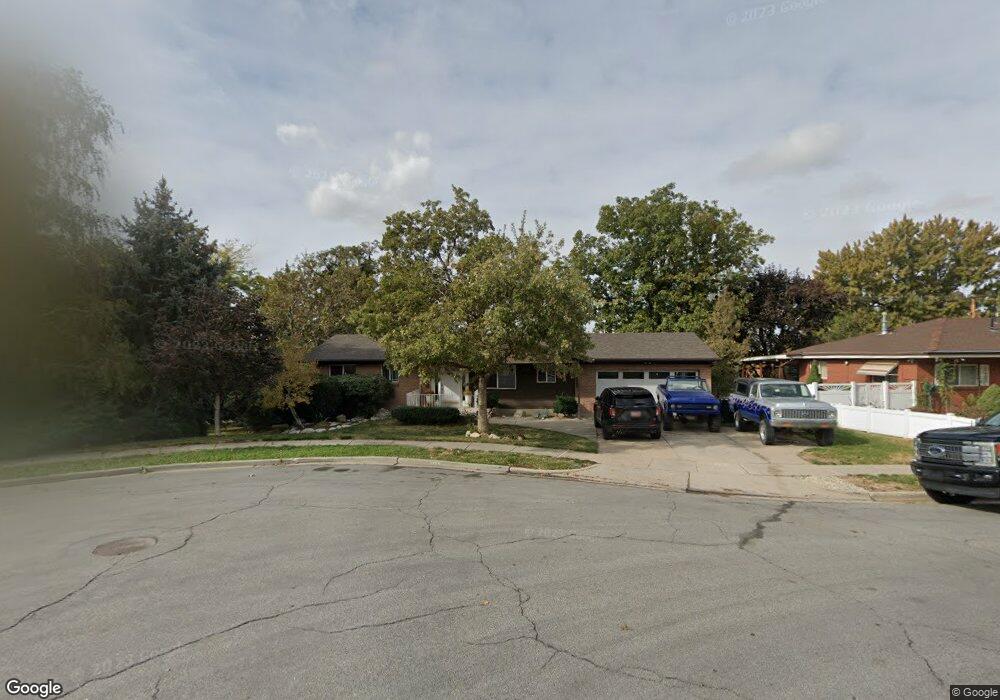
365 N 900 E Bountiful, UT 84010
Estimated Value: $532,000 - $662,000
5
Beds
3
Baths
2,358
Sq Ft
$247/Sq Ft
Est. Value
About This Home
This home is located at 365 N 900 E, Bountiful, UT 84010 and is currently estimated at $581,974, approximately $246 per square foot. 365 N 900 E is a home located in Davis County with nearby schools including Holbrook Elementary School, Millcreek Junior High School, and Bountiful High School.
Ownership History
Date
Name
Owned For
Owner Type
Purchase Details
Closed on
Oct 23, 2020
Sold by
Dodd Lisa Ann
Bought by
Dodd Lisa Ann and Dodd Nathan Gregory
Current Estimated Value
Home Financials for this Owner
Home Financials are based on the most recent Mortgage that was taken out on this home.
Original Mortgage
$332,000
Outstanding Balance
$294,758
Interest Rate
2.8%
Mortgage Type
New Conventional
Estimated Equity
$287,216
Purchase Details
Closed on
Oct 16, 2012
Sold by
Reece Kevin T
Bought by
Dodd Lisa Ann
Home Financials for this Owner
Home Financials are based on the most recent Mortgage that was taken out on this home.
Original Mortgage
$221,408
Interest Rate
4.1%
Mortgage Type
FHA
Purchase Details
Closed on
Jan 12, 2009
Sold by
Porter Franklin Brent
Bought by
Reece Kevin T
Home Financials for this Owner
Home Financials are based on the most recent Mortgage that was taken out on this home.
Original Mortgage
$197,395
Interest Rate
5.97%
Mortgage Type
FHA
Create a Home Valuation Report for This Property
The Home Valuation Report is an in-depth analysis detailing your home's value as well as a comparison with similar homes in the area
Purchase History
| Date | Buyer | Sale Price | Title Company |
|---|---|---|---|
| Dodd Lisa Ann | -- | Advanced Title Ins | |
| Dodd Lisa Ann | -- | Monument Title | |
| Reece Kevin T | -- | First American Title |
Source: Public Records
Mortgage History
| Date | Status | Borrower | Loan Amount |
|---|---|---|---|
| Open | Dodd Lisa Ann | $332,000 | |
| Previous Owner | Dodd Lisa Ann | $221,408 | |
| Previous Owner | Reece Kevin T | $197,395 |
Source: Public Records
Tax History
| Year | Tax Paid | Tax Assessment Tax Assessment Total Assessment is a certain percentage of the fair market value that is determined by local assessors to be the total taxable value of land and additions on the property. | Land | Improvement |
|---|---|---|---|---|
| 2025 | $3,140 | $285,450 | $130,096 | $155,354 |
| 2024 | $2,947 | $277,750 | $120,006 | $157,744 |
| 2023 | $2,913 | $499,000 | $216,839 | $282,161 |
| 2022 | $3,028 | $284,900 | $115,360 | $169,540 |
| 2021 | $2,594 | $372,000 | $171,394 | $200,606 |
| 2020 | $2,283 | $328,000 | $156,080 | $171,920 |
| 2019 | $2,287 | $321,000 | $155,429 | $165,571 |
| 2018 | $2,158 | $298,000 | $144,156 | $153,844 |
| 2016 | $1,783 | $132,880 | $45,356 | $87,524 |
| 2015 | $1,768 | $124,465 | $45,356 | $79,109 |
| 2014 | $1,653 | $119,332 | $45,356 | $73,976 |
| 2013 | -- | $97,438 | $53,629 | $43,809 |
Source: Public Records
Map
Nearby Homes
- 551 N 1100 E
- 1023 E 800 N
- 1105 E 600 N
- 345 N 400 E
- 453 N 400 E Unit 7-D
- 975 E 1050 N
- 908 Northern Hills Dr
- 520 S Orchard Dr Unit 17
- 1342 Northridge Dr
- 49 E 200 N Unit 4
- 41 E 200 N Unit 6
- 55 E 200 N Unit 2
- 51 E 200 N Unit 3
- 275 E Peach Ln S
- 337 Peach Ln
- 256 N Main St
- 254 N Main St
- 252 N Main St
- 323 Peach Ln
- 1342 E Skyline Dr N Unit 30
Your Personal Tour Guide
Ask me questions while you tour the home.