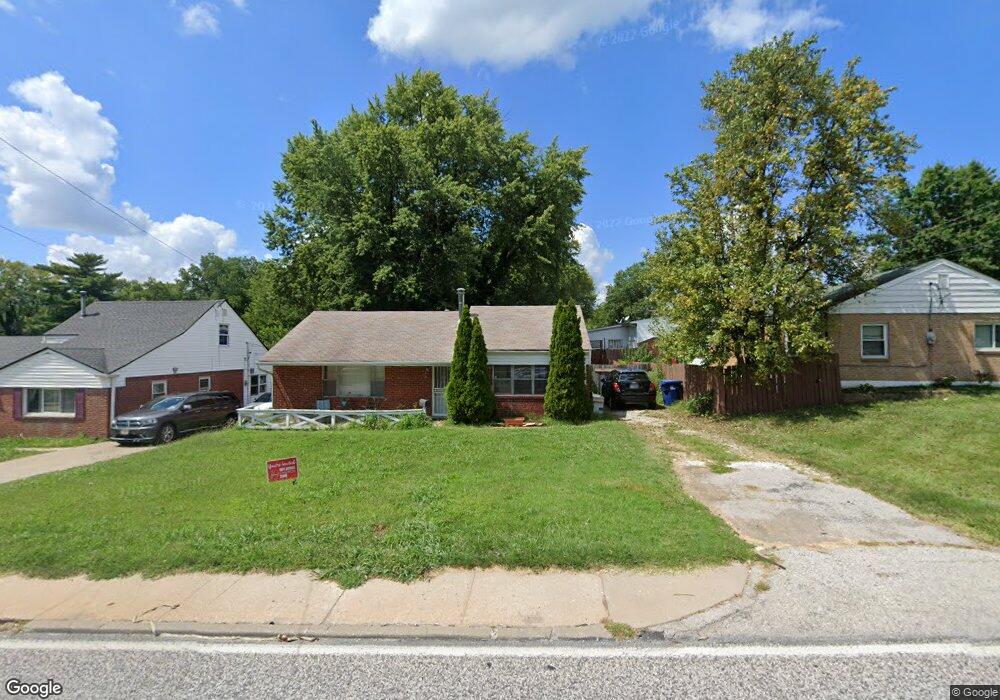
365 N New Florissant Rd Florissant, MO 63031
Estimated Value: $138,050 - $155,000
2
Beds
1
Bath
1,313
Sq Ft
$112/Sq Ft
Est. Value
About This Home
This home is located at 365 N New Florissant Rd, Florissant, MO 63031 and is currently estimated at $147,513, approximately $112 per square foot. 365 N New Florissant Rd is a home located in St. Louis County with nearby schools including Combs Elementary School, Cross Keys Middle School, and McCluer North High School.
Ownership History
Date
Name
Owned For
Owner Type
Purchase Details
Closed on
Sep 21, 2011
Sold by
Secretary Of Housing & Urban Development
Bought by
Bell Moia A
Current Estimated Value
Purchase Details
Closed on
Apr 28, 2011
Sold by
Citimortgage Inc
Bought by
Secretary Of Housing & Urban Development
Purchase Details
Closed on
Apr 18, 2011
Sold by
Robbins Drew
Bought by
Citimortgage Inc
Purchase Details
Closed on
Jun 27, 2008
Sold by
Crowell Anthony S and Crowell Barbara P
Bought by
Robbins Drew
Home Financials for this Owner
Home Financials are based on the most recent Mortgage that was taken out on this home.
Original Mortgage
$83,686
Interest Rate
5.99%
Mortgage Type
FHA
Purchase Details
Closed on
Apr 28, 2004
Sold by
Lamartina Michele L and Lamartina James M
Bought by
Crowell Anthony S and Crowell Barbara P
Home Financials for this Owner
Home Financials are based on the most recent Mortgage that was taken out on this home.
Original Mortgage
$79,273
Interest Rate
5.38%
Mortgage Type
FHA
Create a Home Valuation Report for This Property
The Home Valuation Report is an in-depth analysis detailing your home's value as well as a comparison with similar homes in the area
Home Values in the Area
Average Home Value in this Area
Purchase History
| Date | Buyer | Sale Price | Title Company |
|---|---|---|---|
| Bell Moia A | $20,000 | Northwest Title Agency Texas | |
| Secretary Of Housing & Urban Development | $87,539 | None Available | |
| Citimortgage Inc | $87,539 | None Available | |
| Robbins Drew | $85,000 | Investors Title Company | |
| Crowell Anthony S | $79,900 | -- |
Source: Public Records
Mortgage History
| Date | Status | Borrower | Loan Amount |
|---|---|---|---|
| Previous Owner | Robbins Drew | $83,686 | |
| Previous Owner | Crowell Anthony S | $79,273 |
Source: Public Records
Tax History Compared to Growth
Tax History
| Year | Tax Paid | Tax Assessment Tax Assessment Total Assessment is a certain percentage of the fair market value that is determined by local assessors to be the total taxable value of land and additions on the property. | Land | Improvement |
|---|---|---|---|---|
| 2025 | $1,698 | $23,330 | $3,630 | $19,700 |
| 2024 | $1,698 | $21,760 | $2,510 | $19,250 |
| 2023 | $1,692 | $21,760 | $2,510 | $19,250 |
| 2022 | $1,402 | $15,770 | $3,630 | $12,140 |
| 2021 | $1,378 | $15,770 | $3,630 | $12,140 |
| 2020 | $1,220 | $13,170 | $3,190 | $9,980 |
| 2019 | $1,197 | $13,170 | $3,190 | $9,980 |
| 2018 | $1,399 | $13,810 | $1,840 | $11,970 |
| 2017 | $1,392 | $13,810 | $1,840 | $11,970 |
| 2016 | $1,310 | $12,650 | $3,550 | $9,100 |
| 2015 | $1,318 | $12,650 | $3,550 | $9,100 |
| 2014 | $1,278 | $12,660 | $2,950 | $9,710 |
Source: Public Records
Map
Nearby Homes
- 1130 Saint Francois St
- 940 Harrison St
- 629 Aubuchon St
- 1290 Saint Louis St
- 175 Clark St
- 1023 Saint Denis St
- 260 N Jefferson St
- 865 Boone St
- 305 S Lafayette St
- 1090 Saint Joseph St
- 580 Saint Marie St
- 150 Saint Daniel Ln
- 1965 Saint Catherine St
- 540 S Jefferson St
- 1148 Boone St
- 270 W Saint Anthony Ln
- 1040 Bluefield Dr
- 279 Elmdale Ct
- 505 Ridge Dr
- 215 Maple Dr
- 345 N New Florissant Rd
- 385 N New Florissant Rd
- 1060 Washington St
- 325 N New Florissant Rd
- 1040 Washington St
- 1055 Harrison St
- 305 N New Florissant Rd
- 1035 Harrison St
- 406 N New Florissant Rd
- 350 N New Florissant Rd
- 1020 Washington St
- 360 N New Florissant Rd
- 330 N New Florissant Rd
- 1015 Harrison St
- 990 Washington St
- 310 N New Florissant Rd
- 402 N New Florissant Rd
- 1080 Harrison St
- 995 Harrison St
- 420 N New Florissant Rd