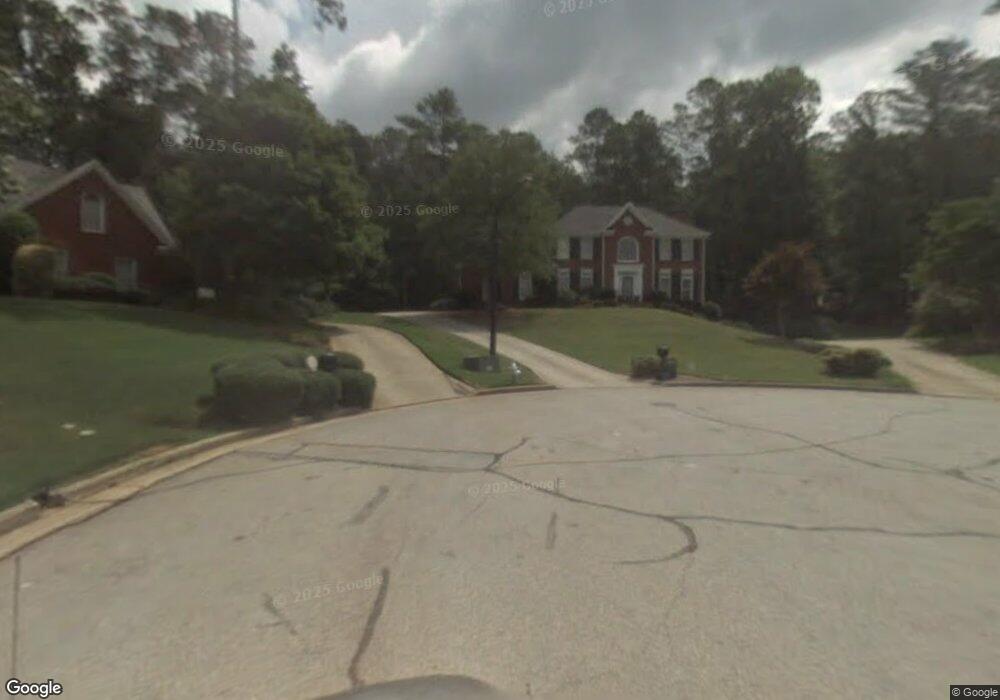
365 Regency Crest Ct SW Atlanta, GA 30331
Midwest Cascade NeighborhoodEstimated Value: $407,000 - $482,000
4
Beds
4
Baths
2,776
Sq Ft
$155/Sq Ft
Est. Value
About This Home
This home is located at 365 Regency Crest Ct SW, Atlanta, GA 30331 and is currently estimated at $430,158, approximately $154 per square foot. 365 Regency Crest Ct SW is a home located in Fulton County with nearby schools including Fickett Elementary School, Bunche Middle School, and Therrell High School.
Ownership History
Date
Name
Owned For
Owner Type
Purchase Details
Closed on
Dec 16, 1994
Sold by
John Wieland Homes Inc
Bought by
Parks Arthur Kecca P
Current Estimated Value
Home Financials for this Owner
Home Financials are based on the most recent Mortgage that was taken out on this home.
Original Mortgage
$203,150
Interest Rate
9.26%
Create a Home Valuation Report for This Property
The Home Valuation Report is an in-depth analysis detailing your home's value as well as a comparison with similar homes in the area
Home Values in the Area
Average Home Value in this Area
Purchase History
| Date | Buyer | Sale Price | Title Company |
|---|---|---|---|
| Parks Arthur Kecca P | $216,900 | -- |
Source: Public Records
Mortgage History
| Date | Status | Borrower | Loan Amount |
|---|---|---|---|
| Closed | Parks Arthur Kecca P | $203,150 |
Source: Public Records
Tax History Compared to Growth
Tax History
| Year | Tax Paid | Tax Assessment Tax Assessment Total Assessment is a certain percentage of the fair market value that is determined by local assessors to be the total taxable value of land and additions on the property. | Land | Improvement |
|---|---|---|---|---|
| 2025 | $2,731 | $147,960 | $29,640 | $118,320 |
| 2023 | $6,026 | $145,560 | $29,640 | $115,920 |
| 2022 | $3,722 | $145,560 | $29,640 | $115,920 |
| 2021 | $2,864 | $118,000 | $27,240 | $90,760 |
| 2020 | $2,841 | $116,560 | $26,880 | $89,680 |
| 2019 | $484 | $114,560 | $26,440 | $88,120 |
| 2018 | $1,968 | $76,000 | $17,600 | $58,400 |
| 2017 | $1,913 | $73,080 | $16,920 | $56,160 |
| 2016 | $1,918 | $73,080 | $16,920 | $56,160 |
| 2015 | $2,389 | $73,080 | $16,920 | $56,160 |
| 2014 | $2,003 | $73,080 | $16,920 | $56,160 |
Source: Public Records
Map
Nearby Homes
- 4240 Cascade Rd SW
- 4181 Danforth Rd SW
- 4400 Celebration Dr SW
- 4395 Celebration Dr SW
- 1055 Elysian Park SW
- 4060 Danforth Rd SW
- 4025 Cascade Rd SW
- 375 Beracah Trail SW
- 375 Beracah Tr SW
- 1155 Apollo Dr SW
- 195 Beracah Walk SW
- 1130 Elysian Park SW Unit LOT 17
- 0 Wilson Mill
- 930 New Hope Rd SW
- 145 Shadybrook Ln SW
- 0 Wilson Mill Rd SW Unit 7606099
- 670 Timbergrove Dr SW
- 4670 Hamden Forest Dr SW
- 3622 Ginnis Rd SW Unit 5
- 380 Regency Crest Ct SW
- 355 Regency Crest Ct SW Unit 22
- 355 Regency Crest Ct SW
- 345 Regency Crest Ct SW Unit 1
- 370 Regency Crest Ct SW Unit 2
- 4360 Park Center Dr SW Unit 2
- 960 Regency Crest Dr SW Unit 1
- 335 Regency Crest Ct SW
- 360 Regency Crest Ct SW
- 4370 Park Center Dr SW
- 950 Regency Crest Dr SW Unit 1
- 4350 Park Center Dr SW
- 4380 Park Center Dr SW
- 4380 Park Center Dr SW Unit 42
- 4380 Park Center Dr SW Unit 99
- 4195 Manor Hills Ln SW
- 325 Regency Crest Ct SW Unit 1
- 940 Regency Crest Dr SW Unit 1
- 970 Regency Crest Dr SW Unit 1
- 350 Regency Crest Ct SW