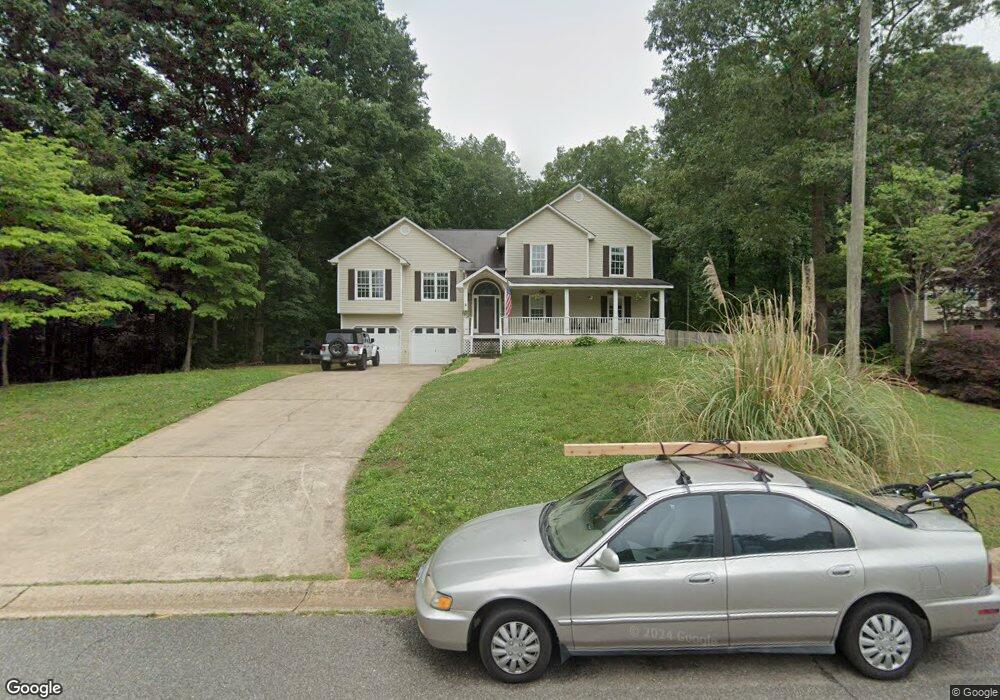
365 Ridge Brook Station Canton, GA 30114
Estimated Value: $474,000 - $474,817
4
Beds
3
Baths
2,564
Sq Ft
$185/Sq Ft
Est. Value
About This Home
This home is located at 365 Ridge Brook Station, Canton, GA 30114 and is currently estimated at $474,409, approximately $185 per square foot. 365 Ridge Brook Station is a home located in Cherokee County with nearby schools including Hasty Elementary School Fine Arts Academy, Teasley Middle School, and Cherokee High School.
Ownership History
Date
Name
Owned For
Owner Type
Purchase Details
Closed on
Jun 22, 2021
Sold by
Padgett Robin C
Bought by
Tanguay Angela Marie and Howe James Michael
Current Estimated Value
Home Financials for this Owner
Home Financials are based on the most recent Mortgage that was taken out on this home.
Original Mortgage
$354,461
Outstanding Balance
$320,920
Interest Rate
2.9%
Mortgage Type
FHA
Estimated Equity
$153,489
Purchase Details
Closed on
May 8, 2000
Sold by
Petrie John B
Bought by
Padgett Robin C and Padgett Henry C
Home Financials for this Owner
Home Financials are based on the most recent Mortgage that was taken out on this home.
Original Mortgage
$124,000
Interest Rate
10%
Mortgage Type
New Conventional
Purchase Details
Closed on
Mar 5, 1998
Sold by
Gravley Max
Bought by
Petrie John B
Home Financials for this Owner
Home Financials are based on the most recent Mortgage that was taken out on this home.
Original Mortgage
$103,120
Interest Rate
6.95%
Mortgage Type
New Conventional
Create a Home Valuation Report for This Property
The Home Valuation Report is an in-depth analysis detailing your home's value as well as a comparison with similar homes in the area
Home Values in the Area
Average Home Value in this Area
Purchase History
| Date | Buyer | Sale Price | Title Company |
|---|---|---|---|
| Tanguay Angela Marie | $361,000 | -- | |
| Padgett Robin C | $155,000 | -- | |
| Petrie John B | $128,900 | -- |
Source: Public Records
Mortgage History
| Date | Status | Borrower | Loan Amount |
|---|---|---|---|
| Open | Tanguay Angela Marie | $354,461 | |
| Previous Owner | Padgett Robin C | $124,000 | |
| Previous Owner | Petrie John B | $103,120 |
Source: Public Records
Tax History Compared to Growth
Tax History
| Year | Tax Paid | Tax Assessment Tax Assessment Total Assessment is a certain percentage of the fair market value that is determined by local assessors to be the total taxable value of land and additions on the property. | Land | Improvement |
|---|---|---|---|---|
| 2024 | $4,935 | $189,884 | $18,400 | $171,484 |
| 2023 | $4,740 | $182,400 | $18,400 | $164,000 |
| 2022 | $3,795 | $144,400 | $17,897 | $126,503 |
| 2021 | $3,787 | $148,440 | $18,400 | $130,040 |
| 2020 | $3,350 | $129,440 | $16,000 | $113,440 |
| 2019 | $2,936 | $109,920 | $14,800 | $95,120 |
| 2018 | $2,723 | $100,080 | $14,800 | $85,280 |
| 2017 | $2,530 | $253,400 | $14,800 | $86,560 |
| 2016 | $2,530 | $224,300 | $14,800 | $74,920 |
| 2015 | $2,297 | $201,100 | $14,800 | $65,640 |
| 2014 | $2,096 | $183,600 | $10,000 | $63,440 |
Source: Public Records
Map
Nearby Homes
- 1521 Larkwood Dr
- 12728A With 1-Acre Bells Ferry Rd
- 253 Woodland Way
- 104 Woodland Ln
- 312 Winston Cir
- 3050 Marietta Hwy
- 631 Butterworth Rd
- 629 Butterworth Rd
- 380 Winston Cir
- 256 Butterworth Rd
- 544 Broughton Dr
- 188 Ivey Dr
- 12728 Bells Ferry Rd
- 106 Henley St
- 135 Henley St
- 129 Henley St
- 138 Henley St Unit 10
- 138 Henley St
- 355 Ridge Brook Station
- 375 Ridge Brook Station
- 1581 Larkwood Dr
- 360 Ridge Rd
- 360 Ridge Brook Station
- 0 Ridge Brook Station Unit 3208509
- 0 Ridge Brook Station
- 370 Ridge Brook Station
- 1601 Larkwood Dr
- 380 Ridge Brook Station
- 350 Ridge Brook Station
- 1571 Larkwood Dr
- 232 Sky Lark Dr
- 340 Ridge Brook Station
- 246 Sky Lark Dr Unit 2
- 1551 Larkwood Dr
- 1590 Larkwood Dr
- 1541 Larkwood Dr
- 320 Ridge Brook Station
- 252 Sky Lark Dr Unit 2