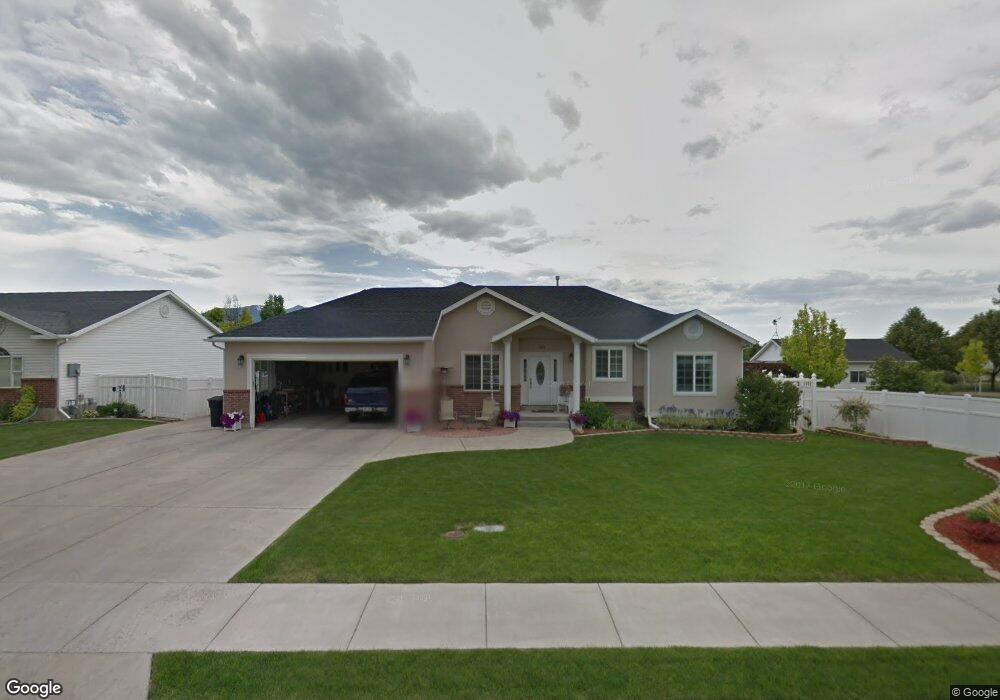
365 S 325 W Providence, UT 84332
Estimated Value: $563,000 - $629,875
3
Beds
3
Baths
3,401
Sq Ft
$173/Sq Ft
Est. Value
About This Home
This home is located at 365 S 325 W, Providence, UT 84332 and is currently estimated at $588,969, approximately $173 per square foot. 365 S 325 W is a home located in Cache County with nearby schools including River Heights School, Spring Creek Middle School, and South Cache Middle School.
Ownership History
Date
Name
Owned For
Owner Type
Purchase Details
Closed on
Apr 15, 2008
Sold by
Hoggard Kenneth D and Hoggard Jan W
Bought by
Shepherd Cory R and Shepherd Miriam S
Current Estimated Value
Home Financials for this Owner
Home Financials are based on the most recent Mortgage that was taken out on this home.
Original Mortgage
$244,800
Outstanding Balance
$155,510
Interest Rate
6.11%
Mortgage Type
New Conventional
Estimated Equity
$433,459
Purchase Details
Closed on
May 2, 2001
Sold by
Bingham Terry L
Bought by
Hoggard Kenneth D and Hoggard Jan W
Home Financials for this Owner
Home Financials are based on the most recent Mortgage that was taken out on this home.
Original Mortgage
$60,000
Interest Rate
6.92%
Create a Home Valuation Report for This Property
The Home Valuation Report is an in-depth analysis detailing your home's value as well as a comparison with similar homes in the area
Home Values in the Area
Average Home Value in this Area
Purchase History
| Date | Buyer | Sale Price | Title Company |
|---|---|---|---|
| Shepherd Cory R | -- | Cache Title Company | |
| Hoggard Kenneth D | -- | Northern Title Company |
Source: Public Records
Mortgage History
| Date | Status | Borrower | Loan Amount |
|---|---|---|---|
| Open | Shepherd Cory R | $244,800 | |
| Previous Owner | Hoggard Kenneth D | $60,000 |
Source: Public Records
Tax History Compared to Growth
Tax History
| Year | Tax Paid | Tax Assessment Tax Assessment Total Assessment is a certain percentage of the fair market value that is determined by local assessors to be the total taxable value of land and additions on the property. | Land | Improvement |
|---|---|---|---|---|
| 2025 | $2,310 | $323,795 | $0 | $0 |
| 2024 | $249 | $324,445 | $0 | $0 |
| 2023 | $2,620 | $321,930 | $0 | $0 |
| 2022 | $2,466 | $286,180 | $0 | $0 |
| 2021 | $2,425 | $431,265 | $75,000 | $356,265 |
| 2020 | $2,191 | $361,396 | $75,000 | $286,396 |
| 2019 | $2,315 | $361,396 | $75,000 | $286,396 |
| 2018 | $2,032 | $324,040 | $75,000 | $249,040 |
| 2017 | $1,818 | $153,395 | $0 | $0 |
| 2016 | $1,838 | $153,395 | $0 | $0 |
| 2015 | $1,698 | $141,420 | $0 | $0 |
| 2014 | $1,657 | $141,420 | $0 | $0 |
| 2013 | -- | $141,420 | $0 | $0 |
Source: Public Records
Map
Nearby Homes