Estimated Value: $236,379 - $269,000
3
Beds
2
Baths
1,485
Sq Ft
$171/Sq Ft
Est. Value
About This Home
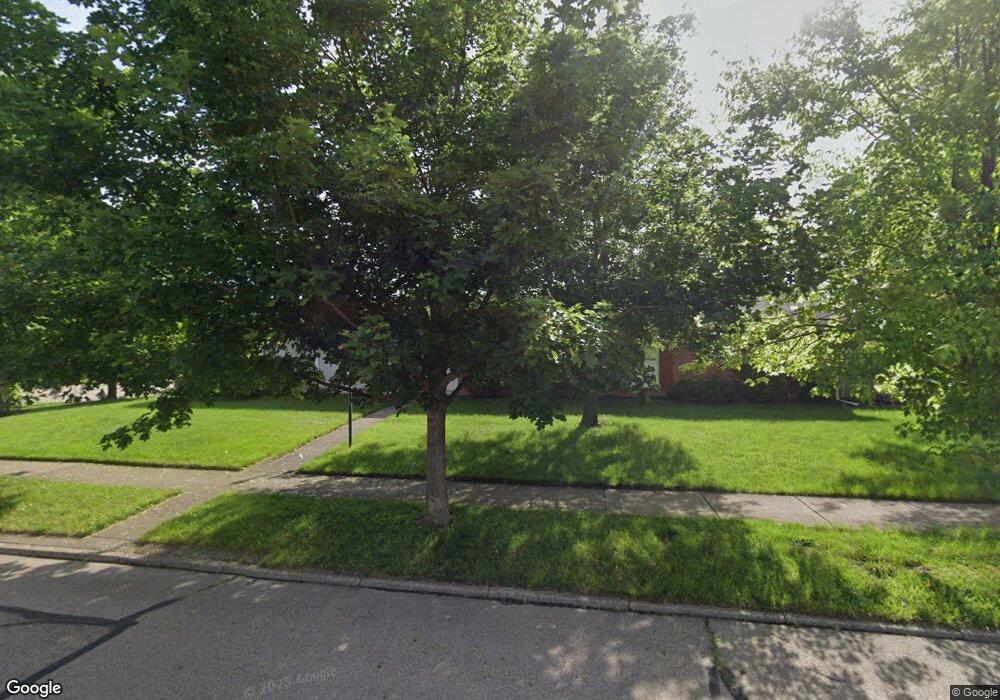
This home is located at 365 Shaftsbury Rd, Troy, OH 45373 and is currently estimated at $253,595, approximately $170 per square foot. 365 Shaftsbury Rd is a home located in Miami County with nearby schools including Cookson Elementary School, Troy Junior High School, and Van Cleve Elementary School.
Ownership History
Date
Name
Owned For
Owner Type
Purchase Details
Closed on
May 20, 2016
Sold by
Mcmullen Ronnie D and Mcmullen Jill S
Bought by
Mcclure Adam G and Mcclure Emily D
Current Estimated Value
Home Financials for this Owner
Home Financials are based on the most recent Mortgage that was taken out on this home.
Original Mortgage
$108,720
Outstanding Balance
$86,322
Interest Rate
3.58%
Mortgage Type
Purchase Money Mortgage
Estimated Equity
$167,273
Purchase Details
Closed on
Jul 28, 2003
Sold by
Barney Shelly and Barney Timothy
Bought by
Mcmullen Ronnie D and Mcmullen Jill S
Home Financials for this Owner
Home Financials are based on the most recent Mortgage that was taken out on this home.
Original Mortgage
$114,900
Interest Rate
5.3%
Mortgage Type
New Conventional
Purchase Details
Closed on
Feb 19, 2002
Sold by
Werling Jeffrey A and Werling Jo Lynn
Bought by
Cole Shelly and Barney Timothy
Home Financials for this Owner
Home Financials are based on the most recent Mortgage that was taken out on this home.
Original Mortgage
$109,000
Interest Rate
7.23%
Mortgage Type
New Conventional
Purchase Details
Closed on
Jun 22, 1994
Sold by
Holman Florence P
Bought by
Werling Jeffrey A
Create a Home Valuation Report for This Property
The Home Valuation Report is an in-depth analysis detailing your home's value as well as a comparison with similar homes in the area
Home Values in the Area
Average Home Value in this Area
Purchase History
| Date | Buyer | Sale Price | Title Company |
|---|---|---|---|
| Mcclure Adam G | $135,900 | Attorney | |
| Mcmullen Ronnie D | $119,900 | -- | |
| Cole Shelly | $115,000 | -- | |
| Werling Jeffrey A | $70,000 | -- |
Source: Public Records
Mortgage History
| Date | Status | Borrower | Loan Amount |
|---|---|---|---|
| Open | Mcclure Adam G | $108,720 | |
| Closed | Cole Shelly | $114,900 | |
| Closed | Cole Shelly | $109,000 | |
| Closed | Werling Jeffrey A | -- |
Source: Public Records
Tax History Compared to Growth
Tax History
| Year | Tax Paid | Tax Assessment Tax Assessment Total Assessment is a certain percentage of the fair market value that is determined by local assessors to be the total taxable value of land and additions on the property. | Land | Improvement |
|---|---|---|---|---|
| 2024 | $2,141 | $56,810 | $12,710 | $44,100 |
| 2023 | $2,141 | $56,810 | $12,710 | $44,100 |
| 2022 | $1,783 | $56,810 | $12,710 | $44,100 |
| 2021 | $1,391 | $42,080 | $9,420 | $32,660 |
| 2020 | $1,393 | $42,080 | $9,420 | $32,660 |
| 2019 | $1,405 | $42,080 | $9,420 | $32,660 |
| 2018 | $1,336 | $38,510 | $10,540 | $27,970 |
| 2017 | $1,350 | $38,510 | $10,540 | $27,970 |
| 2016 | $1,330 | $38,510 | $10,540 | $27,970 |
| 2015 | $1,239 | $34,380 | $9,420 | $24,960 |
| 2014 | $1,239 | $34,380 | $9,420 | $24,960 |
| 2013 | $1,247 | $34,380 | $9,420 | $24,960 |
Source: Public Records
Map
Nearby Homes
- 237 Shaftsbury Rd
- 221 Finsbury Ln
- 755 W Bentley Cir
- 720 Sherwood Dr
- 206 Nottinghill Ln
- 813 W Bentley Cir
- 838 W Bentley Cir
- 708 N Market St
- 1137 Auburn St
- 1160 Waterloo St
- 731 Michigan Ave
- 1164 Waterloo St
- 680 Loxley Ln
- 922 Haverhill Dr
- 1075 Crestview Dr
- 1188 E Bentley Cir
- 725 Loxley Ln
- 546 Loxley Ln
- 250 Merry Robin Rd
- 337 Shaftsbury Rd
- 364 Robin Hood Ln
- 364 Shaftsbury Rd
- 392 Shaftsbury Rd
- 338 Robin Hood Ln
- 309 Shaftsbury Rd
- 425 Shaftsbury Rd
- 251 Merry Robin Rd
- 336 Shaftsbury Rd
- 412 Shaftsbury Rd
- 302 Robin Hood Ln
- 422 Robin Hood Ln
- 308 Shaftsbury Rd
- 289 Shaftsbury Rd
- 432 Shaftsbury Rd
- 288 Shaftsbury Rd
- 456 Robin Hood Ln
- 272 Robin Hood Ln
- 454 Shaftsbury Rd