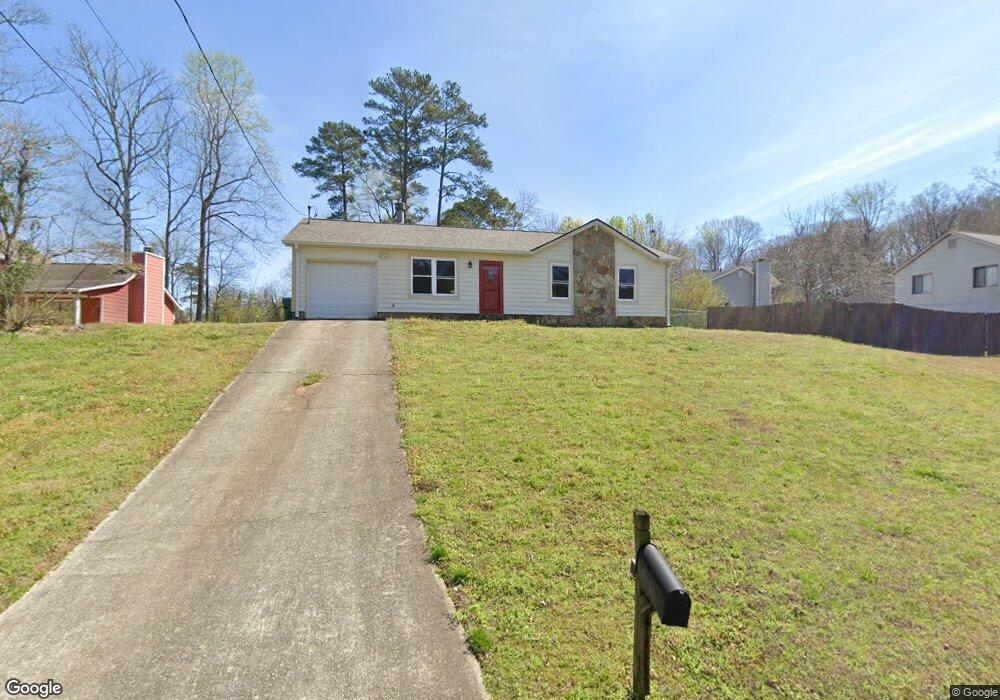
365 Shamrock Ct Unit 1 Tucker, GA 30084
Estimated Value: $252,000 - $327,000
3
Beds
2
Baths
1,251
Sq Ft
$237/Sq Ft
Est. Value
About This Home
This home is located at 365 Shamrock Ct Unit 1, Tucker, GA 30084 and is currently estimated at $297,005, approximately $237 per square foot. 365 Shamrock Ct Unit 1 is a home located in Gwinnett County with nearby schools including Arcado Elementary School, Trickum Middle School, and Parkview High School.
Ownership History
Date
Name
Owned For
Owner Type
Purchase Details
Closed on
Nov 20, 2006
Sold by
Pullium Jennifer K
Bought by
Marquardt Susanna M
Current Estimated Value
Home Financials for this Owner
Home Financials are based on the most recent Mortgage that was taken out on this home.
Original Mortgage
$105,600
Outstanding Balance
$62,560
Interest Rate
6.33%
Mortgage Type
New Conventional
Estimated Equity
$234,445
Purchase Details
Closed on
Feb 24, 1999
Sold by
Guzik Evie A
Bought by
Pullium Jennifer K
Home Financials for this Owner
Home Financials are based on the most recent Mortgage that was taken out on this home.
Original Mortgage
$97,150
Interest Rate
6.82%
Mortgage Type
FHA
Purchase Details
Closed on
Apr 29, 1994
Sold by
Pacitti Suzanne
Bought by
Guzik Evie A
Home Financials for this Owner
Home Financials are based on the most recent Mortgage that was taken out on this home.
Original Mortgage
$55,500
Interest Rate
8.07%
Create a Home Valuation Report for This Property
The Home Valuation Report is an in-depth analysis detailing your home's value as well as a comparison with similar homes in the area
Home Values in the Area
Average Home Value in this Area
Purchase History
| Date | Buyer | Sale Price | Title Company |
|---|---|---|---|
| Marquardt Susanna M | $132,000 | -- | |
| Pullium Jennifer K | $98,000 | -- | |
| Guzik Evie A | $73,500 | -- |
Source: Public Records
Mortgage History
| Date | Status | Borrower | Loan Amount |
|---|---|---|---|
| Open | Marquardt Susanna M | $105,600 | |
| Previous Owner | Pullium Jennifer K | $97,150 | |
| Previous Owner | Guzik Evie A | $55,500 |
Source: Public Records
Tax History Compared to Growth
Tax History
| Year | Tax Paid | Tax Assessment Tax Assessment Total Assessment is a certain percentage of the fair market value that is determined by local assessors to be the total taxable value of land and additions on the property. | Land | Improvement |
|---|---|---|---|---|
| 2025 | $2,846 | $99,760 | $22,200 | $77,560 |
| 2024 | $2,969 | $100,240 | $22,200 | $78,040 |
| 2023 | $2,969 | $102,040 | $28,000 | $74,040 |
| 2022 | $2,551 | $82,160 | $17,600 | $64,560 |
| 2021 | $2,149 | $61,800 | $17,600 | $44,200 |
| 2020 | $2,162 | $61,800 | $17,600 | $44,200 |
| 2019 | $2,100 | $61,800 | $17,600 | $44,200 |
| 2018 | $1,900 | $52,760 | $14,400 | $38,360 |
| 2016 | $1,600 | $42,440 | $12,000 | $30,440 |
| 2015 | $1,411 | $36,760 | $10,000 | $26,760 |
| 2014 | $1,417 | $36,760 | $10,000 | $26,760 |
Source: Public Records
Map
Nearby Homes
- 478 Commons Park Ln
- 0 Mimosa Dr Unit 7691561
- 0 Mimosa Dr Unit 10657667
- 227 Triple Oaks Dr
- 243 Triple Oaks Dr
- 464 Rams Ct
- 6064 Wandering Way Unit 1
- 6043 Rolling Way
- 23 Rock Park Way Unit 26
- 2 Rock Park Way Unit 13
- 8 Rock Park Way Unit 16
- 21 Rock Park Way Unit 27
- 25 Rock Park Way Unit 25
- 27 Rock Park Way Unit 24
- 20 Rock Park Way Unit 19
- 24 Rock Park Way Unit 21
- 28 Rock Park Way Unit 23
- 26 Rock Park Way Unit 22
- 22 Rock Park Way Unit 20
- 6117 Wayburn St
- 375 Shamrock Ct
- 6077 Fire Fly Ct
- 6067 Fire Fly Ct
- 388 Fire Fly Dr
- 6057 Fire Fly Ct Unit 1
- 378 Fire Fly Dr
- 366 Shamrock Ct
- 378 Fire Fly Dr
- 398 Fire Fly Dr Unit 1
- 356 Shamrock Ct
- 376 Shamrock Ct Unit 1
- 386 Shamrock Ct Unit 1
- 386 Shamrock Ct
- 408 Fire Fly Dr
- 6047 Fire Fly Ct
- 6076 Fire Fly Ct Unit 1
- 6066 Fire Fly Ct
- 6107 Fire Fly Ct Unit 1
- 418 Fire Fly Dr
- 396 Shamrock Ct