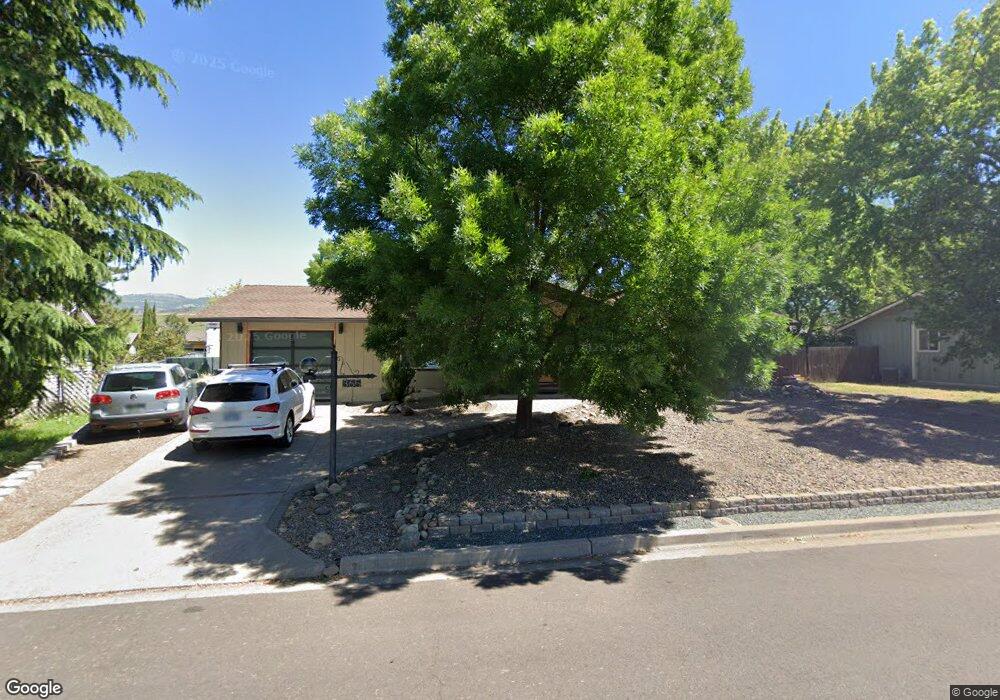
365 Tudor St Ashland, OR 97520
Quiet Village NeighborhoodEstimated Value: $491,129 - $536,000
4
Beds
2
Baths
1,710
Sq Ft
$304/Sq Ft
Est. Value
About This Home
This home is located at 365 Tudor St, Ashland, OR 97520 and is currently estimated at $519,782, approximately $303 per square foot. 365 Tudor St is a home located in Jackson County with nearby schools including Helman Elementary School, Ashland Middle School, and Ashland High School.
Ownership History
Date
Name
Owned For
Owner Type
Purchase Details
Closed on
Jul 12, 2018
Sold by
Fidler Ralph W and Fidler Marilyn R
Bought by
Fidler Mark R and Fidler Darla M
Current Estimated Value
Home Financials for this Owner
Home Financials are based on the most recent Mortgage that was taken out on this home.
Original Mortgage
$280,000
Outstanding Balance
$242,662
Interest Rate
4.5%
Mortgage Type
New Conventional
Estimated Equity
$277,120
Create a Home Valuation Report for This Property
The Home Valuation Report is an in-depth analysis detailing your home's value as well as a comparison with similar homes in the area
Home Values in the Area
Average Home Value in this Area
Purchase History
| Date | Buyer | Sale Price | Title Company |
|---|---|---|---|
| Fidler Mark R | $350,000 | Amerititle |
Source: Public Records
Mortgage History
| Date | Status | Borrower | Loan Amount |
|---|---|---|---|
| Open | Fidler Mark R | $280,000 |
Source: Public Records
Tax History Compared to Growth
Tax History
| Year | Tax Paid | Tax Assessment Tax Assessment Total Assessment is a certain percentage of the fair market value that is determined by local assessors to be the total taxable value of land and additions on the property. | Land | Improvement |
|---|---|---|---|---|
| 2025 | $3,668 | $268,170 | $112,800 | $155,370 |
| 2024 | $3,668 | $260,360 | $109,510 | $150,850 |
| 2023 | $3,549 | $252,780 | $106,320 | $146,460 |
| 2022 | $3,435 | $252,780 | $106,320 | $146,460 |
| 2021 | $3,318 | $245,420 | $103,230 | $142,190 |
| 2020 | $3,225 | $238,280 | $100,230 | $138,050 |
| 2019 | $3,174 | $224,610 | $94,480 | $130,130 |
| 2018 | $3,398 | $218,070 | $91,730 | $126,340 |
| 2017 | $3,374 | $218,070 | $91,730 | $126,340 |
| 2016 | $3,286 | $205,560 | $86,470 | $119,090 |
| 2015 | $3,159 | $205,560 | $86,470 | $119,090 |
| 2014 | $3,056 | $193,770 | $81,510 | $112,260 |
Source: Public Records
Map
Nearby Homes
- 360 Coventry Place
- 662 Vansant St
- 472 Lindsay Ln
- 332 Randy St
- 595 Elizabeth Ave
- 106 Dunn Cir
- 356 Randy St
- 364 Randy St
- 566 Coffee Ln
- 242 Grant St
- 230 Grant St
- 166 Mountain View Dr
- 330 Glenn St
- 581 Scenic Dr Unit 9
- 323 Glenn St Unit 6
- 720 Grover St
- 311 Glenn St Unit 3
- 434 Monte Vista Dr
- 384 Glenn St
- 317 Maple St