
Seller's Agent in 2026
Josh Berney
Berney Realty, LTD
(775) 427-1319
89 in this area
226 Total Sales
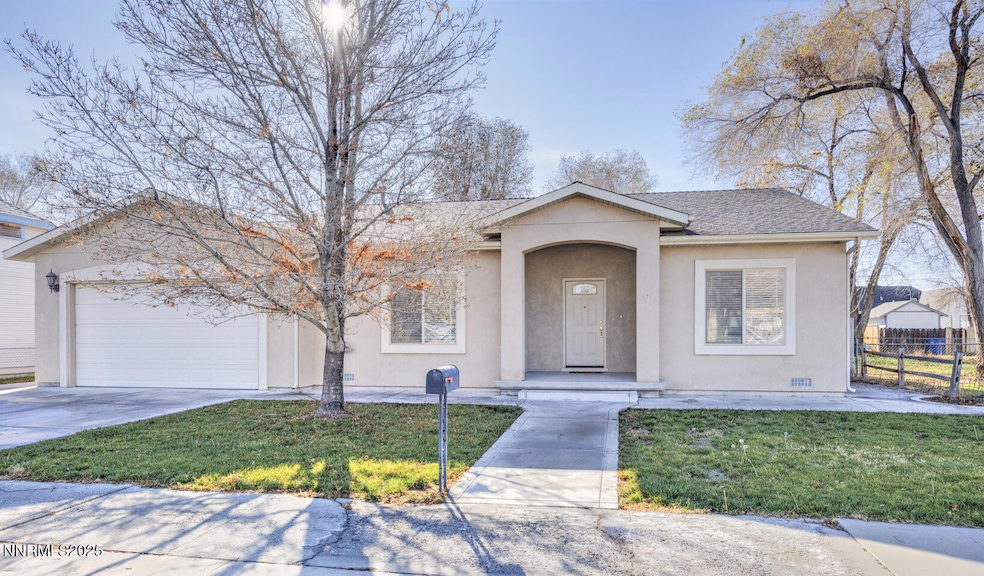
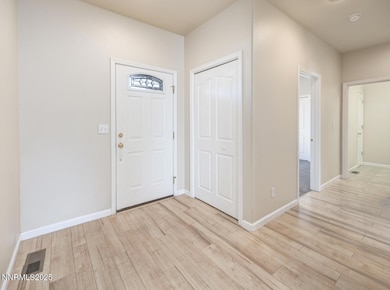
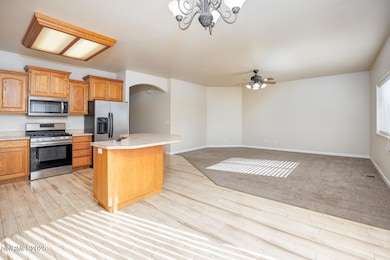
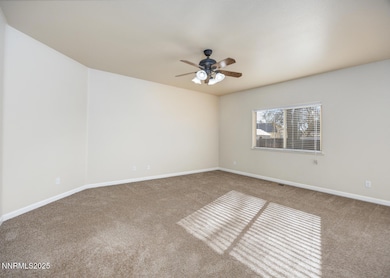
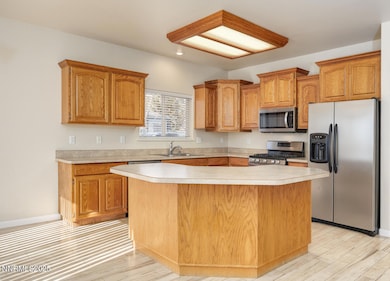
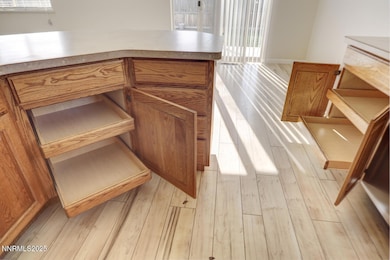
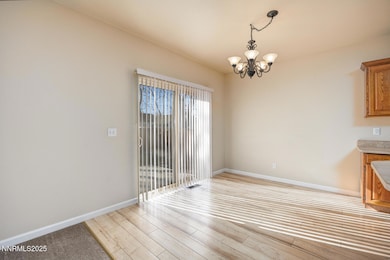
GREAT CITY HOME!! Well maintained 1600+ sqft 3 bed 2 bath home built in 2008 in town w/attached 2 car finished garage. Spacious living room, kitchen with plenty of storage, island with eating bar and dining area. Split floor plan with guest rooms separate from the primary, nice sized primary with large walk-in closet. Landscaped front and back yards, stucco exterior, metal soffit and fascia, gutters and much more!!
Last Agent to Sell the Property
Berney Realty, LTD License #S.181340 Listed on: 11/25/2025
| Date | Type | Sale Price | Title Company |
|---|---|---|---|
| Bargain Sale Deed | $375,000 | Stewart Title Company | |
| Warranty Deed | -- | None Available | |
| Warranty Deed | -- | None Available | |
| Warranty Deed | -- | None Available | |
| Warranty Deed | $165,760 | None Available | |
| Warranty Deed | $50,000 | Western Nevada Title Company | |
| Warranty Deed | -- | None Available | |
| Warranty Deed | $23,311 | None Available |
| Date | Status | Loan Amount | Loan Type |
|---|---|---|---|
| Open | $368,207 | FHA |
| Date | Event | Price | List to Sale | Price per Sq Ft |
|---|---|---|---|---|
| 02/03/2026 02/03/26 | Sold | $375,000 | 0.0% | $232 / Sq Ft |
| 11/25/2025 11/25/25 | For Sale | $375,000 | -- | $232 / Sq Ft |
| Year | Tax Paid | Tax Assessment Tax Assessment Total Assessment is a certain percentage of the fair market value that is determined by local assessors to be the total taxable value of land and additions on the property. | Land | Improvement |
|---|---|---|---|---|
| 2025 | $2,783 | $82,644 | $12,950 | $69,694 |
| 2024 | $2,783 | $82,253 | $12,250 | $70,003 |
| 2023 | $2,783 | $77,677 | $12,250 | $65,427 |
| 2022 | $2,385 | $64,946 | $8,400 | $56,546 |
| 2021 | $2,258 | $63,123 | $8,400 | $54,723 |
| 2020 | $2,190 | $64,103 | $8,400 | $55,703 |
| 2019 | $2,114 | $62,464 | $8,400 | $54,064 |
| 2018 | $2,018 | $61,088 | $8,400 | $52,688 |
| 2017 | $1,937 | $61,008 | $8,400 | $52,608 |
| 2016 | $1,838 | $54,719 | $8,400 | $46,319 |
| 2015 | $1,802 | $49,412 | $8,400 | $41,012 |
| 2014 | $1,755 | $45,656 | $8,400 | $37,256 |
Seller's Agent in 2026
Josh Berney
Berney Realty, LTD
(775) 427-1319
89 in this area
226 Total Sales
Seller Co-Listing Agent in 2026
Shannon Nelson
Berney Realty, LTD
(775) 224-4163
111 in this area
297 Total Sales
Buyer's Agent in 2026
Kim Foster
Dickson Realty - Carson City
(775) 720-8136
1 in this area
26 Total Sales
Source: Northern Nevada Regional MLS
MLS Number: 250058566
APN: 001-525-03
Disclaimer: Certain information contained herein is derived from information provided by parties other than Homes.com. All information provided is deemed reliable, but is not guaranteed to be accurate and should be independently verified.
![]() IDX information is provided exclusively for personal, non-commercial use, and may not be used for any purpose other than to identify prospective properties consumers may be interested in purchasing. Information is deemed reliable but not guaranteed. The content relating to real estate for sale on this web site comes in part from the Broker Reciprocity/ IDX program of the Northern Nevada Regional Multiple Listing Service°. Real estate listings held by brokerage firms other than Ten-X are marked with the Broker Reciprocity logo and detailed information about those listings includes the name of the listing brokerage. Any use of the content other than by a search performed by a consumer looking to purchase or rent real estate is prohibited. © 2026 Northern Nevada Regional Multiple Listing Service® MLS. All rights reserved.
IDX information is provided exclusively for personal, non-commercial use, and may not be used for any purpose other than to identify prospective properties consumers may be interested in purchasing. Information is deemed reliable but not guaranteed. The content relating to real estate for sale on this web site comes in part from the Broker Reciprocity/ IDX program of the Northern Nevada Regional Multiple Listing Service°. Real estate listings held by brokerage firms other than Ten-X are marked with the Broker Reciprocity logo and detailed information about those listings includes the name of the listing brokerage. Any use of the content other than by a search performed by a consumer looking to purchase or rent real estate is prohibited. © 2026 Northern Nevada Regional Multiple Listing Service® MLS. All rights reserved.
Ask me questions while you tour the home.