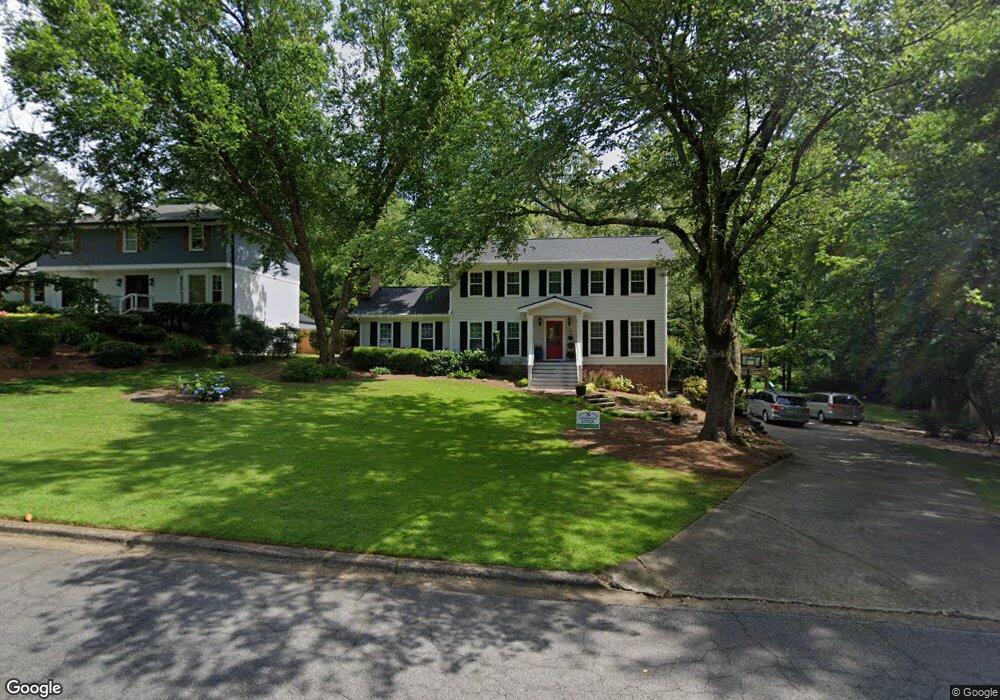
365 Wickerberry Ln Roswell, GA 30075
Estimated Value: $600,000 - $639,000
4
Beds
3
Baths
2,167
Sq Ft
$290/Sq Ft
Est. Value
About This Home
This home is located at 365 Wickerberry Ln, Roswell, GA 30075 and is currently estimated at $628,494, approximately $290 per square foot. 365 Wickerberry Ln is a home located in Fulton County with nearby schools including Roswell North Elementary School, Crabapple Middle School, and Roswell High School.
Ownership History
Date
Name
Owned For
Owner Type
Purchase Details
Closed on
Nov 10, 2003
Sold by
Menedez Robert L and Menedez Natalie H
Bought by
Pellegri Mark
Current Estimated Value
Home Financials for this Owner
Home Financials are based on the most recent Mortgage that was taken out on this home.
Original Mortgage
$191,200
Interest Rate
5.75%
Mortgage Type
New Conventional
Purchase Details
Closed on
May 25, 2001
Sold by
Rollison Robin H
Bought by
Menedez Robert L and Menedez Natalie
Home Financials for this Owner
Home Financials are based on the most recent Mortgage that was taken out on this home.
Original Mortgage
$184,400
Interest Rate
7.11%
Mortgage Type
New Conventional
Purchase Details
Closed on
Nov 7, 1997
Sold by
Hasty Harry C and Hasty Gay H
Bought by
Rollison Robin H
Home Financials for this Owner
Home Financials are based on the most recent Mortgage that was taken out on this home.
Original Mortgage
$126,400
Interest Rate
6.87%
Mortgage Type
New Conventional
Create a Home Valuation Report for This Property
The Home Valuation Report is an in-depth analysis detailing your home's value as well as a comparison with similar homes in the area
Home Values in the Area
Average Home Value in this Area
Purchase History
| Date | Buyer | Sale Price | Title Company |
|---|---|---|---|
| Pellegri Mark | $238,000 | -- | |
| Menedez Robert L | $230,500 | -- | |
| Rollison Robin H | $158,000 | -- |
Source: Public Records
Mortgage History
| Date | Status | Borrower | Loan Amount |
|---|---|---|---|
| Closed | Pellegri Mark | $191,200 | |
| Previous Owner | Menedez Robert L | $184,400 | |
| Previous Owner | Rollison Robin H | $126,400 |
Source: Public Records
Tax History Compared to Growth
Tax History
| Year | Tax Paid | Tax Assessment Tax Assessment Total Assessment is a certain percentage of the fair market value that is determined by local assessors to be the total taxable value of land and additions on the property. | Land | Improvement |
|---|---|---|---|---|
| 2025 | $627 | $177,760 | $60,280 | $117,480 |
| 2023 | $4,351 | $154,160 | $31,080 | $123,080 |
| 2022 | $2,424 | $154,160 | $31,080 | $123,080 |
| 2021 | $2,892 | $140,640 | $28,120 | $112,520 |
| 2020 | $2,941 | $151,200 | $25,920 | $125,280 |
| 2019 | $493 | $123,880 | $30,920 | $92,960 |
| 2018 | $2,790 | $121,000 | $30,200 | $90,800 |
| 2017 | $2,369 | $94,200 | $21,080 | $73,120 |
| 2016 | $2,356 | $94,200 | $21,080 | $73,120 |
| 2015 | $2,878 | $94,200 | $21,080 | $73,120 |
| 2014 | $2,259 | $86,440 | $19,320 | $67,120 |
Source: Public Records
Map
Nearby Homes
- 5060 Magnolia Walk
- 8040 Magnolia Way
- 9760 Loblolly Ln
- 525 Wickerberry Ln
- 385 Roswell Farms Rd Unit 2
- 340 Farm Path Unit 2
- 1070 Stonegrove Ln
- 545 Longleaf Dr Unit 1
- 130 Farm Hill Cir
- 445 Longleaf Dr
- 420 Longleaf Dr
- 325 Farm Trace
- 145 Grayton Ln
- 1130 Lake Dr
- 85 Webb St
- 300 Farm Track Unit 3
- 610 Pine Grove Rd
- 355 Wickerberry Ln
- 345 Wickerberry Ln
- 350 Wickenberry
- 350 Wickenberry Unit 350
- 350 Wickerberry Ln
- 350 Wickerberry Ln Unit 350
- 9870 Coleman Rd
- 240 Farm Ct
- 370 Wickerberry Ln
- 340 Wickerberry Ln
- 335 Wickerberry Ln
- 395 Wickerberry Ln
- 380 Wickerberry Ln
- 380 Wickerberry Ln Unit 10
- 330 Wickerberry Ln
- 230 Farm Ct
- 235 Farm Ct
- 325 Wickerberry Ln
- 405 Wickerberry Ln
- 6035 Magnolia Walk