
Landlord's Agent in 2021
Talithia Morris
EXP Realty, LLC
(703) 344-6762
3 in this area
142 Total Sales
Estimated Value: $668,907 - $762,000
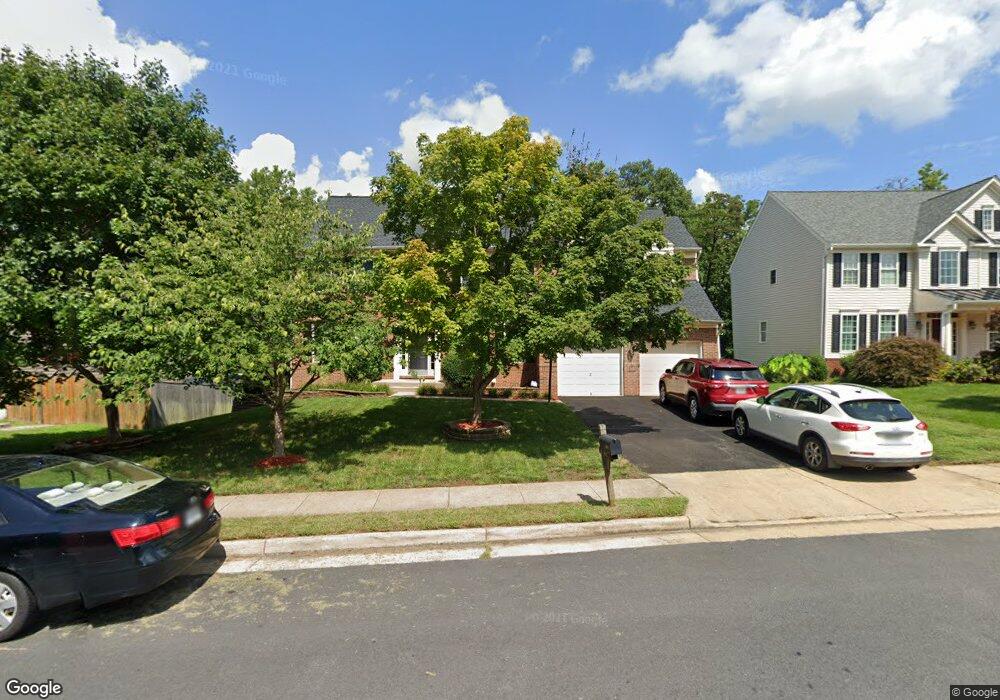
This home is located at 3650 Thomasson Crossing Dr, Triangle, VA 22172 since 17 May 2021 and is currently priced at $715,227. This property was built in 2006. 3650 Thomasson Crossing Dr is a home located in Prince William County with nearby schools including Triangle Elementary School, Graham Park Middle School, and Potomac High School.
Last Agent to Rent the Property
(866) 825-7169 va.broker@exprealty.net EXP Realty, LLC License #0225226152 Listed on: 05/17/2021
Last Renter's Agent
(703) 378-8810 donnysamson@samsonproperties.net Samson Properties License #0225191808
| Date | Buyer | Sale Price | Title Company |
|---|---|---|---|
| Triangle3650 Llc | -- | None Listed On Document | |
| Virupannavar Vikrant | $385,000 | First American Title Ins Co | |
| Ffc Properties Llc | $235,100 | -- | |
| Ffc Properties Llc | $235,100 | None Available | |
| Marquina Rosa | $664,090 | -- |
| Date | Status | Borrower | Loan Amount |
|---|---|---|---|
| Previous Owner | Virupannavar Vikrant | $308,000 | |
| Previous Owner | Marquina Rosa | $531,272 |
| Date | Event | Price | List to Sale | Price per Sq Ft |
|---|---|---|---|---|
| 05/18/2021 05/18/21 | Rented | $3,000 | +17.6% | -- |
| 05/17/2021 05/17/21 | Under Contract | -- | -- | -- |
| 05/17/2021 05/17/21 | For Rent | $2,550 | +4.1% | -- |
| 09/11/2017 09/11/17 | Rented | $2,450 | -7.5% | -- |
| 09/11/2017 09/11/17 | Under Contract | -- | -- | -- |
| 07/10/2017 07/10/17 | For Rent | $2,650 | +8.2% | -- |
| 09/09/2013 09/09/13 | Rented | $2,450 | 0.0% | -- |
| 09/08/2013 09/08/13 | Under Contract | -- | -- | -- |
| 07/26/2013 07/26/13 | For Rent | $2,450 | 0.0% | -- |
| 11/20/2012 11/20/12 | Rented | $2,450 | -3.9% | -- |
| 11/19/2012 11/19/12 | Under Contract | -- | -- | -- |
| 10/18/2012 10/18/12 | For Rent | $2,550 | -- | -- |
| Year | Tax Paid | Tax Assessment Tax Assessment Total Assessment is a certain percentage of the fair market value that is determined by local assessors to be the total taxable value of land and additions on the property. | Land | Improvement |
|---|---|---|---|---|
| 2025 | $6,263 | $657,500 | $235,500 | $422,000 |
| 2024 | $6,263 | $629,800 | $226,500 | $403,300 |
| 2023 | $6,036 | $580,100 | $208,000 | $372,100 |
| 2022 | $5,981 | $540,000 | $192,800 | $347,200 |
| 2021 | $5,946 | $487,400 | $173,900 | $313,500 |
| 2020 | $7,068 | $456,000 | $162,600 | $293,400 |
| 2019 | $6,981 | $450,400 | $161,000 | $289,400 |
| 2018 | $5,313 | $440,000 | $157,900 | $282,100 |
| 2017 | $5,287 | $429,100 | $153,400 | $275,700 |
| 2016 | $5,255 | $430,600 | $153,400 | $277,200 |
| 2015 | $5,098 | $415,500 | $147,500 | $268,000 |
| 2014 | $5,098 | $408,600 | $144,700 | $263,900 |
Landlord's Agent in 2021
Talithia Morris
EXP Realty, LLC
(703) 344-6762
3 in this area
142 Total Sales
Tenant's Agent in 2021
Antonio Hayes
Samson Properties
(703) 474-5485
23 Total Sales
T
Seller's Agent in 2017
Tony Ward
Fathom Realty
(703) 856-2884
2 Total Sales
Buyer's Agent in 2017
Beth Grant
Samson Properties
(703) 626-1563
32 Total Sales
Buyer's Agent in 2013
Nakita Mattocks
Real Broker, LLC
(571) 330-2484
1 in this area
37 Total Sales
Source: Bright MLS
MLS Number: VAPW521426
APN: 8288-13-2227
Disclaimer: Certain information contained herein is derived from information provided by parties other than Homes.com. All information provided is deemed reliable, but is not guaranteed to be accurate and should be independently verified.
![]() The data relating to real estate for sale on this website appears in part through the BRIGHT Internet Data Exchange program, a voluntary cooperative exchange of property listing data between licensed real estate brokerage firms, and is provided by BRIGHT through a licensing agreement.
The data relating to real estate for sale on this website appears in part through the BRIGHT Internet Data Exchange program, a voluntary cooperative exchange of property listing data between licensed real estate brokerage firms, and is provided by BRIGHT through a licensing agreement.
Listing information is from various brokers who participate in the Bright MLS IDX program and not all listings may be visible on the site.
The property information being provided on or through the website is for the personal, non-commercial use of consumers and such information may not be used for any purpose other than to identify prospective properties consumers may be interested in purchasing.
Some properties which appear for sale on the website may no longer be available because they are for instance, under contract, sold or are no longer being offered for sale.
Property information displayed is deemed reliable but is not guaranteed.
Copyright 2026 Bright MLS, Inc.
Ask me questions while you tour the home.