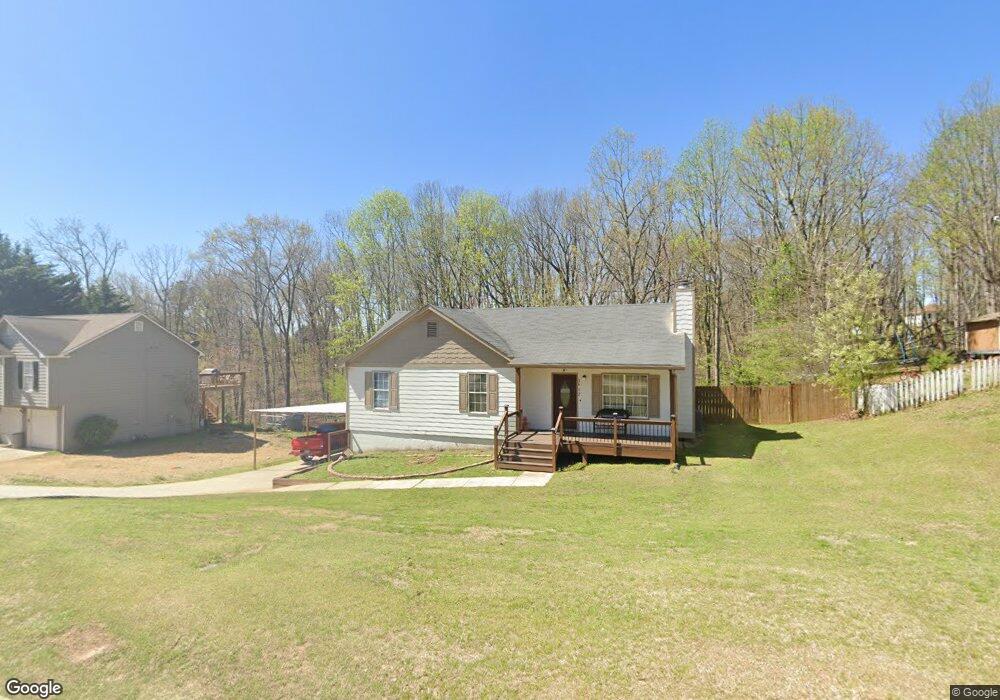
3652 E Bolding Rd Flowery Branch, GA 30542
Estimated Value: $236,000 - $296,000
3
Beds
2
Baths
1,167
Sq Ft
$228/Sq Ft
Est. Value
About This Home
This home is located at 3652 E Bolding Rd, Flowery Branch, GA 30542 and is currently estimated at $266,618, approximately $228 per square foot. 3652 E Bolding Rd is a home located in Hall County with nearby schools including Chicopee Elementary School, South Hall Middle School, and Johnson High School.
Ownership History
Date
Name
Owned For
Owner Type
Purchase Details
Closed on
Aug 31, 2009
Sold by
Fannie Mae
Bought by
Gomez Luis F
Current Estimated Value
Home Financials for this Owner
Home Financials are based on the most recent Mortgage that was taken out on this home.
Original Mortgage
$90,824
Outstanding Balance
$59,399
Interest Rate
5.19%
Mortgage Type
FHA
Estimated Equity
$207,219
Purchase Details
Closed on
Apr 7, 2009
Sold by
Wells Fargo Bank Na
Bought by
Federal National Mortgage Association
Purchase Details
Closed on
Jun 20, 2003
Sold by
North Robert
Bought by
3652 East Bolding Road Land Trus
Home Financials for this Owner
Home Financials are based on the most recent Mortgage that was taken out on this home.
Original Mortgage
$108,000
Interest Rate
5.42%
Mortgage Type
New Conventional
Purchase Details
Closed on
Jan 1, 1995
Purchase Details
Closed on
Jul 1, 1994
Create a Home Valuation Report for This Property
The Home Valuation Report is an in-depth analysis detailing your home's value as well as a comparison with similar homes in the area
Home Values in the Area
Average Home Value in this Area
Purchase History
| Date | Buyer | Sale Price | Title Company |
|---|---|---|---|
| Gomez Luis F | -- | -- | |
| Federal National Mortgage Association | -- | -- | |
| Wells Fargo Bank Na | $87,525 | -- | |
| 3652 East Bolding Road Land Trus | -- | -- | |
| North Robert | $120,000 | -- | |
| -- | $83,900 | -- | |
| -- | $16,000 | -- |
Source: Public Records
Mortgage History
| Date | Status | Borrower | Loan Amount |
|---|---|---|---|
| Open | Gomez Luis F | $90,824 | |
| Previous Owner | North Robert | $108,000 |
Source: Public Records
Tax History Compared to Growth
Tax History
| Year | Tax Paid | Tax Assessment Tax Assessment Total Assessment is a certain percentage of the fair market value that is determined by local assessors to be the total taxable value of land and additions on the property. | Land | Improvement |
|---|---|---|---|---|
| 2024 | $2,019 | $78,800 | $9,160 | $69,640 |
| 2023 | $2,022 | $78,920 | $9,160 | $69,760 |
| 2022 | $1,708 | $63,480 | $9,160 | $54,320 |
| 2021 | $1,586 | $57,640 | $9,160 | $48,480 |
| 2020 | $1,560 | $55,000 | $9,160 | $45,840 |
| 2019 | $1,390 | $48,280 | $9,160 | $39,120 |
| 2018 | $1,255 | $41,920 | $9,160 | $32,760 |
| 2017 | $1,124 | $37,680 | $9,160 | $28,520 |
| 2016 | $1,098 | $37,640 | $9,160 | $28,480 |
| 2015 | $851 | $28,346 | $6,040 | $22,306 |
| 2014 | $851 | $28,346 | $6,040 | $22,306 |
Source: Public Records
Map
Nearby Homes
- 3478 Abbey Way
- 3617 Winder Hwy
- 3969 Bolding Rd
- 3607 Wood Point Way
- 3936 Overlook Ridge Ln
- 3583 Atlanta Hwy
- 4008 Amberleigh Trace
- 4044 Amberleigh Trace
- 4013 Amberleigh Trace
- 5351 Fox Den Rd
- 5117 Fox Den Rd
- 5209 Fox Den Rd
- 4020 Parks Rd
- 3929 Perry Ln
- 4315 Marble Arch Way
- 0 Marble Arch Way
- 4086 Parks Rd
- 3648 E Bolding Rd
- 3656 E Bolding Rd
- E E Bolding Rd
- 3655 E Bolding Rd
- 3651 E Bolding Rd
- 3660 E Bolding Rd
- 3644 E Bolding Rd
- 3659 E Bolding Rd
- 3647 E Bolding Rd
- 3640 E Bolding Rd
- 3663 E Bolding Rd
- 3664 E Bolding Rd
- 3643 E Bolding Rd
- 3667 E Bolding Rd
- 3639 E Bolding Rd
- 3636 E Bolding Rd
- 3668 E Bolding Rd
- 3635 E Bolding Rd
- 3634 E Bolding Rd
- 3672 E Bolding Rd