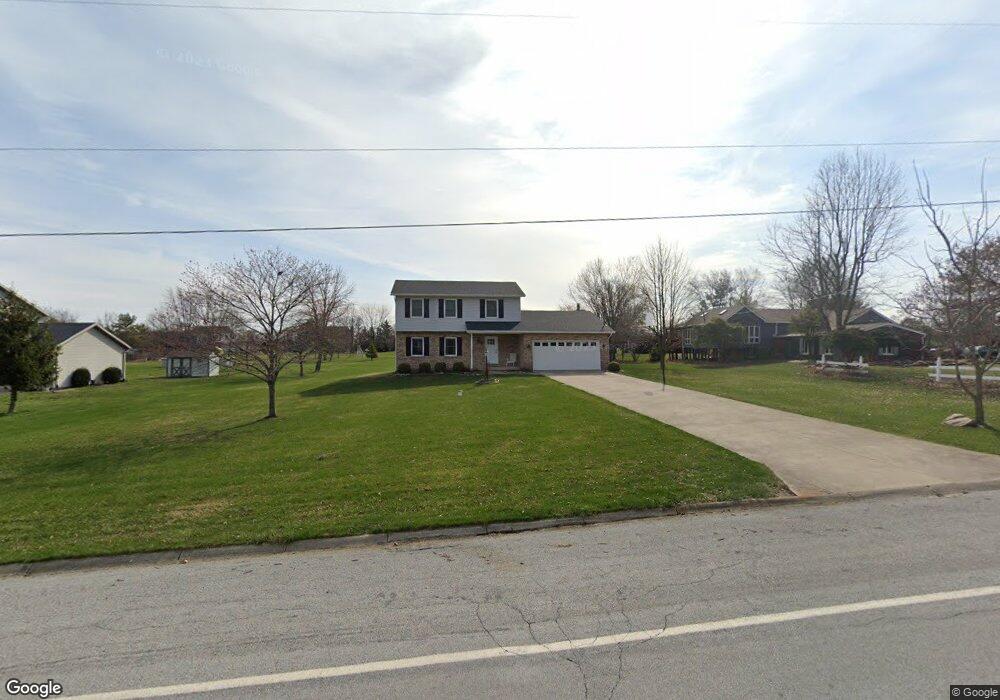
3652 Petre Rd Springfield, OH 45502
Estimated Value: $291,000 - $397,000
4
Beds
3
Baths
1,620
Sq Ft
$210/Sq Ft
Est. Value
About This Home
This home is located at 3652 Petre Rd, Springfield, OH 45502 and is currently estimated at $339,608, approximately $209 per square foot. 3652 Petre Rd is a home located in Clark County with nearby schools including Possum Elementary School, Shawnee Middle School/High School, and Springfield Preparatory & Fitness Academy.
Ownership History
Date
Name
Owned For
Owner Type
Purchase Details
Closed on
May 10, 2011
Sold by
Mounts Eric N and Mounts Andrea L
Bought by
Mounts Caleb J and Mounts Emily A
Current Estimated Value
Home Financials for this Owner
Home Financials are based on the most recent Mortgage that was taken out on this home.
Original Mortgage
$137,700
Outstanding Balance
$94,671
Interest Rate
4.88%
Mortgage Type
New Conventional
Estimated Equity
$244,937
Purchase Details
Closed on
Sep 29, 1995
Sold by
R David Stevenson Inc
Bought by
Mounts Eric N and Mounts Andrea
Home Financials for this Owner
Home Financials are based on the most recent Mortgage that was taken out on this home.
Original Mortgage
$117,600
Interest Rate
8%
Mortgage Type
New Conventional
Purchase Details
Closed on
Sep 15, 1988
Create a Home Valuation Report for This Property
The Home Valuation Report is an in-depth analysis detailing your home's value as well as a comparison with similar homes in the area
Purchase History
We collect this data history from publicly available records. To have your information removed, we recommend requesting removal directly through your county’s website.
| Date | Buyer | Sale Price | Title Company |
|---|---|---|---|
| Mounts Caleb J | $153,000 | Ohio Real Estate Title | |
| Mounts Eric N | $147,000 | -- | |
| -- | -- | -- |
Source: Public Records
Mortgage History
We collect this data history from publicly available records. To have your information removed, we recommend requesting removal directly through your county’s website.
| Date | Status | Borrower | Loan Amount |
|---|---|---|---|
| Open | Mounts Caleb J | $137,700 | |
| Closed | Mounts Eric N | $117,600 |
Source: Public Records
Tax History
| Year | Tax Paid | Tax Assessment Tax Assessment Total Assessment is a certain percentage of the fair market value that is determined by local assessors to be the total taxable value of land and additions on the property. | Land | Improvement |
|---|---|---|---|---|
| 2025 | $3,681 | $85,100 | $17,360 | $67,740 |
| 2024 | $3,585 | $73,400 | $15,010 | $58,390 |
| 2023 | $3,585 | $73,400 | $15,010 | $58,390 |
| 2022 | $3,556 | $73,400 | $15,010 | $58,390 |
| 2021 | $3,282 | $60,650 | $12,400 | $48,250 |
| 2020 | $3,309 | $60,650 | $12,400 | $48,250 |
| 2019 | $3,361 | $60,650 | $12,400 | $48,250 |
| 2018 | $3,149 | $56,060 | $12,900 | $43,160 |
| 2017 | $3,227 | $56,063 | $12,901 | $43,162 |
| 2016 | $2,911 | $56,063 | $12,901 | $43,162 |
| 2015 | $2,898 | $53,946 | $12,404 | $41,542 |
| 2014 | $2,906 | $53,946 | $12,404 | $41,542 |
| 2013 | $2,525 | $53,946 | $12,404 | $41,542 |
Source: Public Records
Map
Nearby Homes
- 3628 Petre Rd
- 3722 Marbella Ave
- 1166 W Sparrow Rd
- 419 S Yellow Springs St
- 1448 W Sparrow Rd
- 758 Oneida Dr
- 2642 Springfield Xenia Rd
- 151 Kinnane Ave
- 402 Highview Ave
- 201 Kinnane Ave
- 505 Highview Ave
- 711 Kinnane Ave
- 2064 Fairfield Pike
- 5406 Springfield Jamestown Rd
- 427 Knickerbocker Ave
- 2301 Duquesne Dr
- 1014 Driscoll Ave
- 1217 Driscoll Ave
- 1730 Damascus Ave
- 1846 Ohio Ave
- 3672 Petre Rd
- 3700 Petre Rd
- 3600 Petre Rd
- 3659 Marbella Ave
- 3722 Petre Rd
- 3576 Petre Rd
- 3641 Marbella Ave
- 3703 Marbella Ave
- 3681 Marbella Ave
- 3623 Marbella Ave
- 3744 Petre Rd
- 3558 Petre Rd
- 3709 Petre Rd
- 3725 Marbella Ave
- 3658 Marbella Ave
- 3678 Marbella Ave
- 3636 Marbella Ave
- 3601 Marbella Ave
- 3700 Marbella Ave
- 3747 Marbella Ave
Your Personal Tour Guide
Ask me questions while you tour the home.