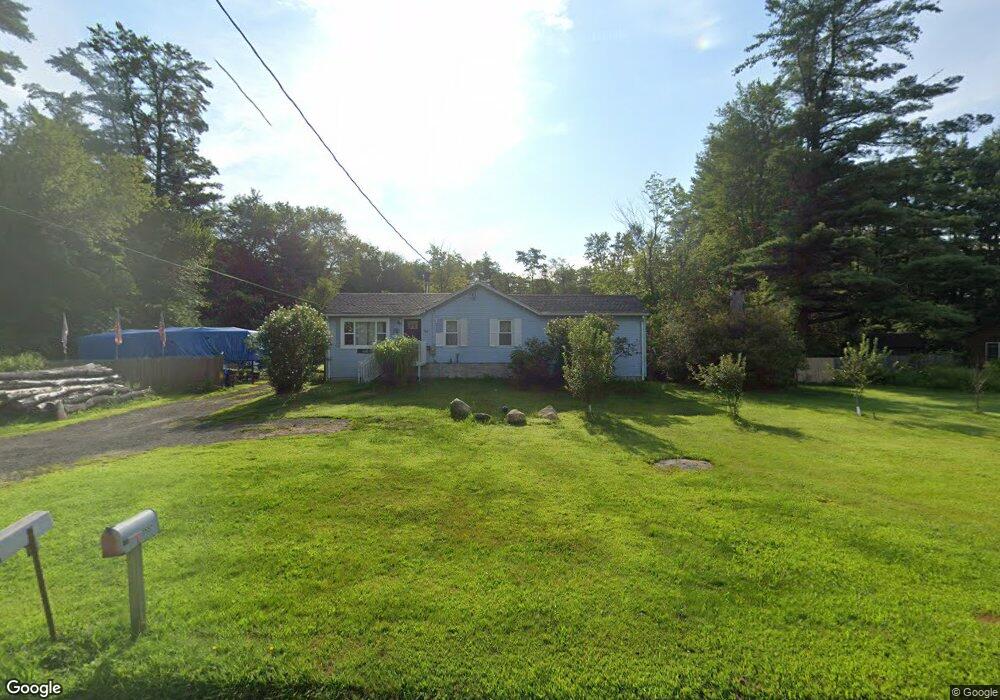
3652 Torringford St Torrington, CT 06790
Estimated Value: $235,000 - $278,000
3
Beds
1
Bath
1,072
Sq Ft
$239/Sq Ft
Est. Value
About This Home
This home is located at 3652 Torringford St, Torrington, CT 06790 and is currently estimated at $256,076, approximately $238 per square foot. 3652 Torringford St is a home located in Litchfield County with nearby schools including Torrington Middle School, Torrington High School, and St Anthony School.
Ownership History
Date
Name
Owned For
Owner Type
Purchase Details
Closed on
Dec 13, 2004
Sold by
Dallaire Richard and Dallaire Maryanne
Bought by
Spring Todd A and Curtis Lou Anne
Current Estimated Value
Home Financials for this Owner
Home Financials are based on the most recent Mortgage that was taken out on this home.
Original Mortgage
$131,200
Outstanding Balance
$65,267
Interest Rate
5.63%
Estimated Equity
$190,809
Purchase Details
Closed on
Aug 31, 1999
Sold by
Aames Capital Corp
Bought by
Dallaire Richard and Dallaire Maryanne
Purchase Details
Closed on
May 29, 1997
Sold by
Bankers Trust Co Ca
Bought by
Stockmal Steven M and Stockmal Sherye A
Purchase Details
Closed on
Oct 16, 1996
Sold by
First Bank Beverly Hls
Bought by
Bankers Trust Of Ca Tr
Create a Home Valuation Report for This Property
The Home Valuation Report is an in-depth analysis detailing your home's value as well as a comparison with similar homes in the area
Home Values in the Area
Average Home Value in this Area
Purchase History
| Date | Buyer | Sale Price | Title Company |
|---|---|---|---|
| Spring Todd A | $164,000 | -- | |
| Dallaire Richard | $33,000 | -- | |
| Stockmal Steven M | $70,000 | -- | |
| Bankers Trust Of Ca Tr | $87,646 | -- |
Source: Public Records
Mortgage History
| Date | Status | Borrower | Loan Amount |
|---|---|---|---|
| Open | Bankers Trust Of Ca Tr | $131,200 | |
| Closed | Bankers Trust Of Ca Tr | $32,800 |
Source: Public Records
Tax History Compared to Growth
Tax History
| Year | Tax Paid | Tax Assessment Tax Assessment Total Assessment is a certain percentage of the fair market value that is determined by local assessors to be the total taxable value of land and additions on the property. | Land | Improvement |
|---|---|---|---|---|
| 2025 | $5,047 | $131,250 | $28,700 | $102,550 |
| 2024 | $3,510 | $73,170 | $28,700 | $44,470 |
| 2023 | $3,509 | $73,170 | $28,700 | $44,470 |
| 2022 | $3,449 | $73,170 | $28,700 | $44,470 |
| 2021 | $3,378 | $73,170 | $28,700 | $44,470 |
| 2020 | $3,378 | $73,170 | $28,700 | $44,470 |
| 2019 | $3,413 | $73,930 | $34,580 | $39,350 |
| 2018 | $3,413 | $73,930 | $34,580 | $39,350 |
| 2017 | $3,382 | $73,930 | $34,580 | $39,350 |
| 2016 | $3,382 | $73,930 | $34,580 | $39,350 |
| 2015 | $3,382 | $73,930 | $34,580 | $39,350 |
| 2014 | $3,916 | $107,810 | $59,770 | $48,040 |
Source: Public Records
Map
Nearby Homes
- 35 White Pine Rd
- 3222 Torringford St
- 230 White Oak Way
- 109 Winterberry Way
- 229 White Oak Way
- 225 White Oak Way
- 353A Hayden Hill Rd
- 190 Hayden Hill Rd
- 260 Hayden Hill Rd
- 2793 Torringford St W
- 257 Torringford St
- 38 Auburn Way
- 7 Stadler Heights
- 172 Hillandale Blvd
- KENNEDY DRIVE & Torringford St
- 819 E Wakefield Blvd
- 674 E Wakefield Blvd
- 722 Lake Dr
- 408 A Niles Rd
- 114 Old Farms Rd
- 3644 Torringford St
- 3651 Torringford St
- 3618 Torringford St
- 3588 Torringford St
- 3748 Torringford St
- 3674 Torringford St
- 3766 Torringford St
- 3511 Torringford St
- 3800 Torringford St
- 299 Industrial Ln
- 3810 Torringford St
- 3807 Torringford St
- 142 Industrial Ln
- 219 Industrial Ln
- 3828 Torringford St
- 15 Putter Ln
- 3464 Torringford St
- 341 Pinewoods Rd
- 3465 Torringford St
- 349 Ella Grasso Ave