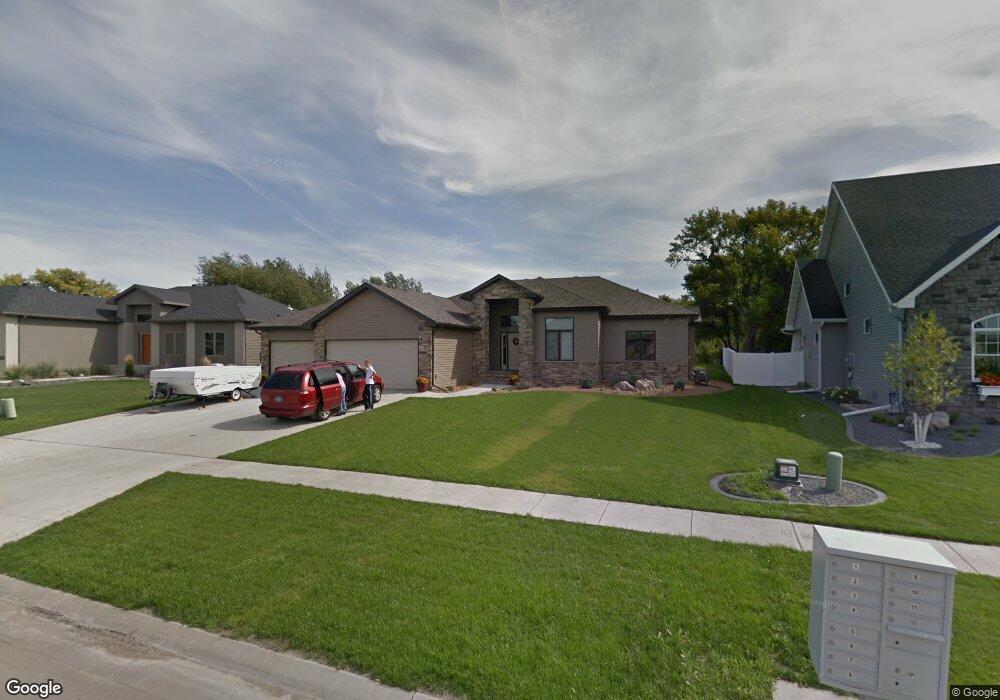
3653 Hidden Cir West Fargo, ND 58078
Knutson NeighborhoodEstimated Value: $719,000 - $817,000
5
Beds
3
Baths
4,096
Sq Ft
$186/Sq Ft
Est. Value
About This Home
This home is located at 3653 Hidden Cir, West Fargo, ND 58078 and is currently estimated at $760,938, approximately $185 per square foot. 3653 Hidden Cir is a home located in Cass County with nearby schools including Aurora Elementary School, Liberty Middle School, and West Fargo Sheyenne High School.
Ownership History
Date
Name
Owned For
Owner Type
Purchase Details
Closed on
Apr 30, 2015
Sold by
Devries Matthew De and Devries Laurie De
Bought by
Vries Matthew J De and Vries Laurie A De
Current Estimated Value
Purchase Details
Closed on
Mar 13, 2013
Sold by
Heritage Homes Llc
Bought by
Devries Mathew and Devries Laurie
Home Financials for this Owner
Home Financials are based on the most recent Mortgage that was taken out on this home.
Original Mortgage
$403,139
Interest Rate
3.5%
Mortgage Type
New Conventional
Purchase Details
Closed on
Apr 30, 2012
Sold by
Holoien Development Co Llc
Bought by
Heritage Homes Inc
Create a Home Valuation Report for This Property
The Home Valuation Report is an in-depth analysis detailing your home's value as well as a comparison with similar homes in the area
Home Values in the Area
Average Home Value in this Area
Purchase History
| Date | Buyer | Sale Price | Title Company |
|---|---|---|---|
| Vries Matthew J De | -- | None Available | |
| Devries Mathew | $424,347 | None Available | |
| Heritage Homes Inc | $71,000 | None Available |
Source: Public Records
Mortgage History
| Date | Status | Borrower | Loan Amount |
|---|---|---|---|
| Previous Owner | Devries Mathew | $403,139 |
Source: Public Records
Tax History Compared to Growth
Tax History
| Year | Tax Paid | Tax Assessment Tax Assessment Total Assessment is a certain percentage of the fair market value that is determined by local assessors to be the total taxable value of land and additions on the property. | Land | Improvement |
|---|---|---|---|---|
| 2024 | $8,662 | $328,250 | $58,950 | $269,300 |
| 2023 | $8,553 | $324,100 | $58,950 | $265,150 |
| 2022 | $8,388 | $305,000 | $58,950 | $246,050 |
| 2021 | $7,734 | $276,050 | $48,250 | $227,800 |
| 2020 | $7,302 | $266,500 | $48,250 | $218,250 |
| 2019 | $7,199 | $260,500 | $48,250 | $212,250 |
| 2018 | $11,337 | $269,600 | $48,250 | $221,350 |
| 2017 | $11,102 | $265,600 | $48,250 | $217,350 |
| 2016 | $9,565 | $225,050 | $48,250 | $176,800 |
| 2015 | $8,217 | $150,150 | $32,050 | $118,100 |
| 2014 | $8,110 | $210,400 | $32,050 | $178,350 |
| 2013 | $8,404 | $140,850 | $32,050 | $108,800 |
Source: Public Records
Map
Nearby Homes
- 3755 Houkom Dr E
- 3830 3rd St E
- 414 Westview Ln E
- 421 Westview Ln E
- 3784 Bell Blvd E
- 6511 Osgood Pkwy S
- 522 Westview Ln E
- 3767 Bell Blvd E
- 3371 1st St
- 436 35th Ave E
- 3405 4th St E
- 3463 Loberg Dr
- 4337 66th St S
- 3479 Loberg Ln
- 4355 66th St S
- 3662 N Sedona Ct
- 503 33rd Way E Unit B
- 3502 8th St E
- 3037 Claire Dr E
- 433 Foxtail Dr
- 3659 Hidden Cir
- 3647 Hidden Cir
- 3641 Hidden Cir
- 3665 Hidden Cir
- 3652 Hidden Cir
- 3658 Hidden Cir
- 3646 Hidden Cir
- 3701 Hidden Cir
- 3635 Hidden Cir
- 3664 Hidden Cir
- 3640 Hidden Cir
- 3713 Hidden Cir
- 3629 Hidden Cir
- 3634 Hidden Cir
- 3706 Hidden Cir
- 3719 Hidden Cir
- 3628 Hidden Cir
- 3712 Hidden Cir
- 3623 Hidden Cir
- 221 37th Ave E