3655 E 2619th Rd Sheridan, IL 60551
Estimated Value: $471,000 - $753,000
4
Beds
3
Baths
3,700
Sq Ft
$151/Sq Ft
Est. Value
About This Home
This home is located at 3655 E 2619th Rd, Sheridan, IL 60551 and is currently estimated at $557,593, approximately $150 per square foot. 3655 E 2619th Rd is a home located in LaSalle County with nearby schools including Serena High School and Sheridan Sda Elementary School.
Ownership History
Date
Name
Owned For
Owner Type
Purchase Details
Closed on
Aug 12, 2011
Sold by
James S Gollps Revocable Trust
Bought by
Nigro Mitchell S and Nigro Roxane J
Current Estimated Value
Purchase Details
Closed on
Aug 22, 2008
Sold by
Gallops James S and Dissell Richard L
Bought by
Gallops James S and Dissell Richard L
Purchase Details
Closed on
Oct 30, 2007
Sold by
Schoeberlein Leonard and Schoeberlein Diane
Bought by
Gallops James S and Dissell Richard L
Home Financials for this Owner
Home Financials are based on the most recent Mortgage that was taken out on this home.
Original Mortgage
$245,000
Interest Rate
6.38%
Mortgage Type
New Conventional
Purchase Details
Closed on
Sep 25, 2007
Sold by
White Oak Development Inc
Bought by
Schoeberlein Leonard R and Schoeberlein Diana M
Home Financials for this Owner
Home Financials are based on the most recent Mortgage that was taken out on this home.
Original Mortgage
$245,000
Interest Rate
6.38%
Mortgage Type
New Conventional
Create a Home Valuation Report for This Property
The Home Valuation Report is an in-depth analysis detailing your home's value as well as a comparison with similar homes in the area
Purchase History
| Date | Buyer | Sale Price | Title Company |
|---|---|---|---|
| Nigro Mitchell S | $265,000 | None Available | |
| Gallops James S | -- | None Available | |
| Gallops James S | $490,000 | First American Title Insuran | |
| Schoeberlein Leonard R | -- | None Available |
Source: Public Records
Mortgage History
| Date | Status | Borrower | Loan Amount |
|---|---|---|---|
| Previous Owner | Gallops James S | $245,000 |
Source: Public Records
Tax History
| Year | Tax Paid | Tax Assessment Tax Assessment Total Assessment is a certain percentage of the fair market value that is determined by local assessors to be the total taxable value of land and additions on the property. | Land | Improvement |
|---|---|---|---|---|
| 2024 | $5,298 | $125,530 | $25,160 | $100,370 |
| 2023 | $5,572 | $117,935 | $23,638 | $94,297 |
| 2022 | $5,859 | $107,009 | $21,448 | $85,561 |
| 2021 | $5,975 | $100,252 | $20,094 | $80,158 |
| 2020 | $6,285 | $96,619 | $19,366 | $77,253 |
| 2019 | $5,979 | $92,849 | $18,610 | $74,239 |
| 2018 | $5,727 | $88,034 | $17,645 | $70,389 |
| 2017 | $5,353 | $82,622 | $16,869 | $65,753 |
| 2016 | $5,370 | $82,746 | $16,894 | $65,852 |
| 2015 | $5,835 | $85,446 | $17,445 | $68,001 |
| 2012 | -- | $87,204 | $17,804 | $69,400 |
Source: Public Records
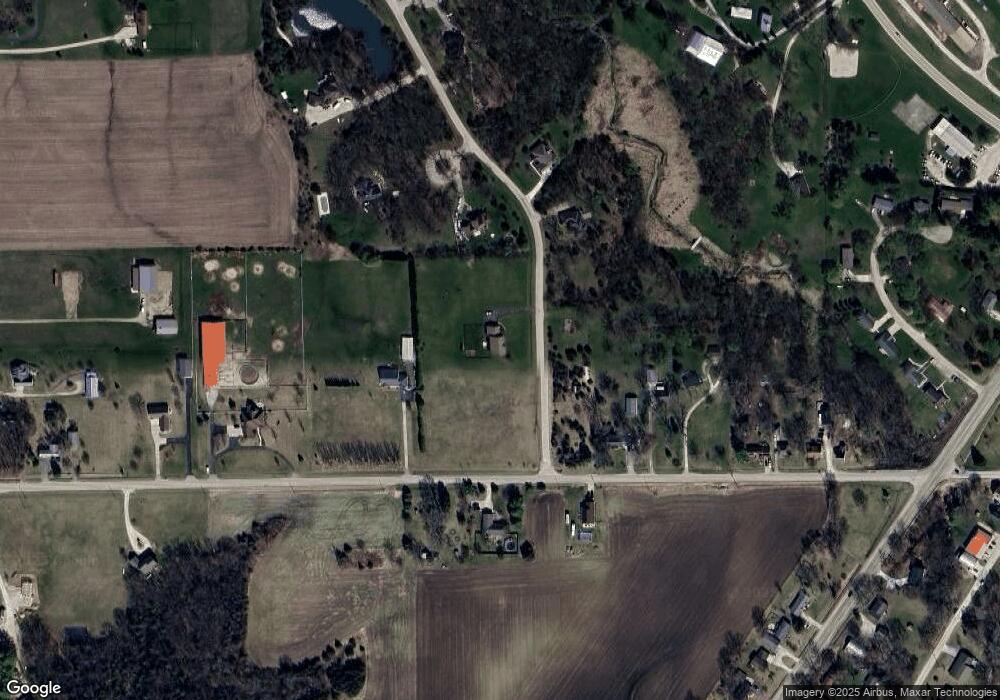
Map
Nearby Homes
- 3668 E 2619th Rd
- 2601 N 3653rd Rd
- 2618 N 3689th Rd
- 2607 N 3689th Rd
- 2605 N 3689th Rd
- 2603 N 3689th Rd
- 3669 E 25th Rd
- 3757 N Il Route 71
- 3916 E 2589th Rd
- 0 U S Route 52
- 2271 N 3806th Rd
- 2265 N 3806th Rd
- 2273 N 3409th Rd
- 3837 E 30th Rd
- 3526 E 2179th Rd
- 000 W County Line Rd
- 2469 N 41st Rd
- 2402 N 41st Rd
- 2382 N 41st Rd
- 2790 N 4201st Rd
- 3655 E 2619 Th Rd
- 2606 E 2619th Rd
- 3664 E 2619th Rd
- 2613 N 3653rd Rd
- 2599 N 3653rd Rd
- 2615 N 3653rd Rd
- 2596 N 3653 Rd
- 3666 E 2619th Rd
- 2617 N 3653rd Rd
- 2601 N 3669th Rd
- 2608 N 3653rd Rd
- 2608 N 3653rd Rd
- 2612 N 3653rd Rd
- 2628 N 3653rd Rd
- 3668 E 2619 Th Rd
- 2601 N 3650rd Rd
- 2619 N 3653rd Rd
- 0000 N 3653 Rd
- lot 1 3653 Rd
- lot 2 3653 Rd
Your Personal Tour Guide
Ask me questions while you tour the home.