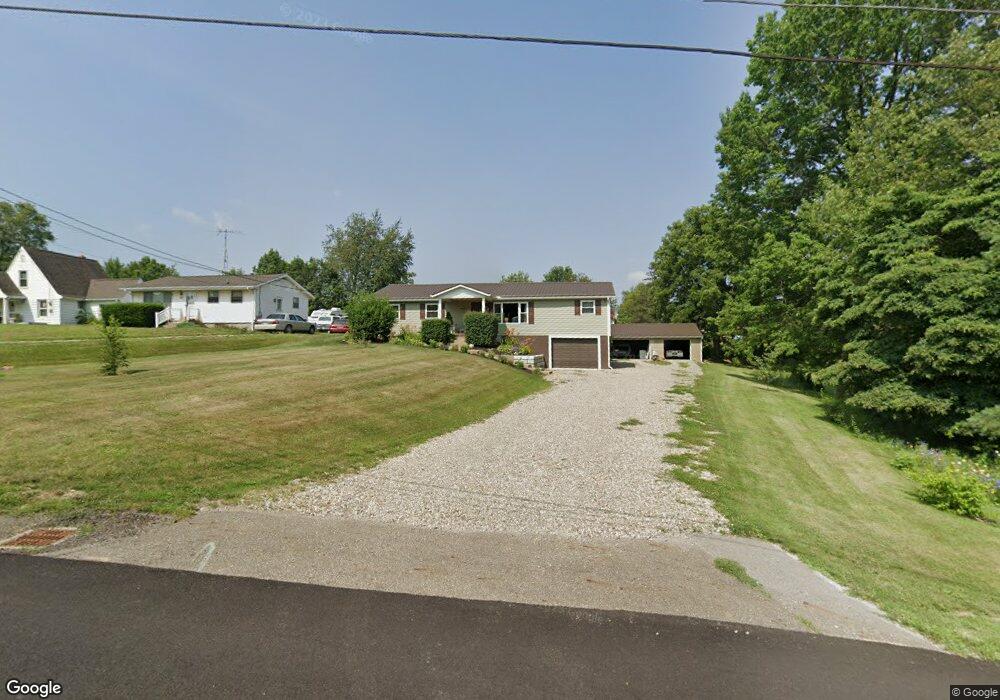
3655 Highview Ave SW Canton, OH 44706
Estimated Value: $142,000 - $196,000
--
Bed
--
Bath
--
Sq Ft
9,932
Sq Ft Lot
About This Home
This home is located at 3655 Highview Ave SW, Canton, OH 44706 and is currently estimated at $169,000. 3655 Highview Ave SW is a home located in Stark County with nearby schools including Faircrest Memorial Elementary School, Canton South High School, and Beacon Academy.
Ownership History
Date
Name
Owned For
Owner Type
Purchase Details
Closed on
Jun 5, 2020
Sold by
Heakin Katherine and King Katherine F
Bought by
King Katherine F and King Ryan A
Current Estimated Value
Home Financials for this Owner
Home Financials are based on the most recent Mortgage that was taken out on this home.
Original Mortgage
$107,800
Outstanding Balance
$95,556
Interest Rate
3.2%
Mortgage Type
New Conventional
Estimated Equity
$73,444
Purchase Details
Closed on
Oct 9, 2013
Sold by
Kennedy Diane Kay
Bought by
Heakin Katherine
Home Financials for this Owner
Home Financials are based on the most recent Mortgage that was taken out on this home.
Original Mortgage
$91,832
Interest Rate
4.5%
Mortgage Type
New Conventional
Purchase Details
Closed on
Oct 4, 2012
Sold by
Thompson Norma J
Bought by
Kennedy Diane K
Create a Home Valuation Report for This Property
The Home Valuation Report is an in-depth analysis detailing your home's value as well as a comparison with similar homes in the area
Home Values in the Area
Average Home Value in this Area
Purchase History
| Date | Buyer | Sale Price | Title Company |
|---|---|---|---|
| King Katherine F | $1,000 | Service First Title Agcy Ltd | |
| Heakin Katherine | $95,000 | None Available | |
| Heakin Katherine | -- | None Available | |
| Kennedy Diane K | -- | None Available |
Source: Public Records
Mortgage History
| Date | Status | Borrower | Loan Amount |
|---|---|---|---|
| Open | King Katherine F | $107,800 | |
| Previous Owner | Heakin Katherine | $91,832 |
Source: Public Records
Tax History Compared to Growth
Tax History
| Year | Tax Paid | Tax Assessment Tax Assessment Total Assessment is a certain percentage of the fair market value that is determined by local assessors to be the total taxable value of land and additions on the property. | Land | Improvement |
|---|---|---|---|---|
| 2025 | -- | $5,880 | $3,640 | $2,240 |
| 2024 | -- | $5,880 | $3,640 | $2,240 |
| 2023 | $300 | $5,360 | $2,450 | $2,910 |
| 2022 | $274 | $5,360 | $2,450 | $2,910 |
| 2021 | $273 | $5,360 | $2,450 | $2,910 |
| 2020 | $272 | $4,560 | $2,070 | $2,490 |
| 2019 | $285 | $4,560 | $2,070 | $2,490 |
| 2018 | $282 | $4,560 | $2,070 | $2,490 |
| 2017 | $311 | $5,010 | $1,930 | $3,080 |
| 2016 | $323 | $5,010 | $1,930 | $3,080 |
| 2015 | $315 | $5,010 | $1,930 | $3,080 |
| 2014 | $302 | $4,380 | $1,680 | $2,700 |
| 2013 | $150 | $4,380 | $1,680 | $2,700 |
Source: Public Records
Map
Nearby Homes
- 3673 Highview Ave SW
- 3641 Diane Ave SW
- 3415 Cleveland Ave SW
- 236 32nd St SW
- 223 Faircrest St SW
- 3245 Sierra Ave SW
- 3939 Cleveland Ave SW
- 1521 Bravado Rd SW
- 1550 Rebel St SW
- 4314 Millport Ave SW
- 4624 Ridge Ave SE
- 3223 Dueber Ave SW
- 5226 Ashmont Ave SW
- 1926 Village St SE
- 900 53rd St SW
- 340 53rd St SW
- 4805 Harvest Cir SE
- 5327 Dunfred Cir SE
- 5346 Shaker Valley Cir SE
- 5333 Dunfred Cir SE
- 3655 Highview Ave SW
- 3661 Highview Ave SW
- 3669 Highview Ave SW
- 3633 Highview Ave SW
- 3650 Diane Ave SW
- 3656 Highview Ave SW
- 3640 Diane Ave SW
- 3664 Highview Ave SW
- 3638 Highview Ave SW
- 401 37th St SW
- 3626 Highview Ave SW
- 3630 Diane Ave SW
- 3630 Diane Ave SW
- 327 37th St SW
- 435 37th St SW
- 317 37th St SW
- 236 Carnwise St SW
- 300 Carnwise St SW
- 3701 Highview Ave SW