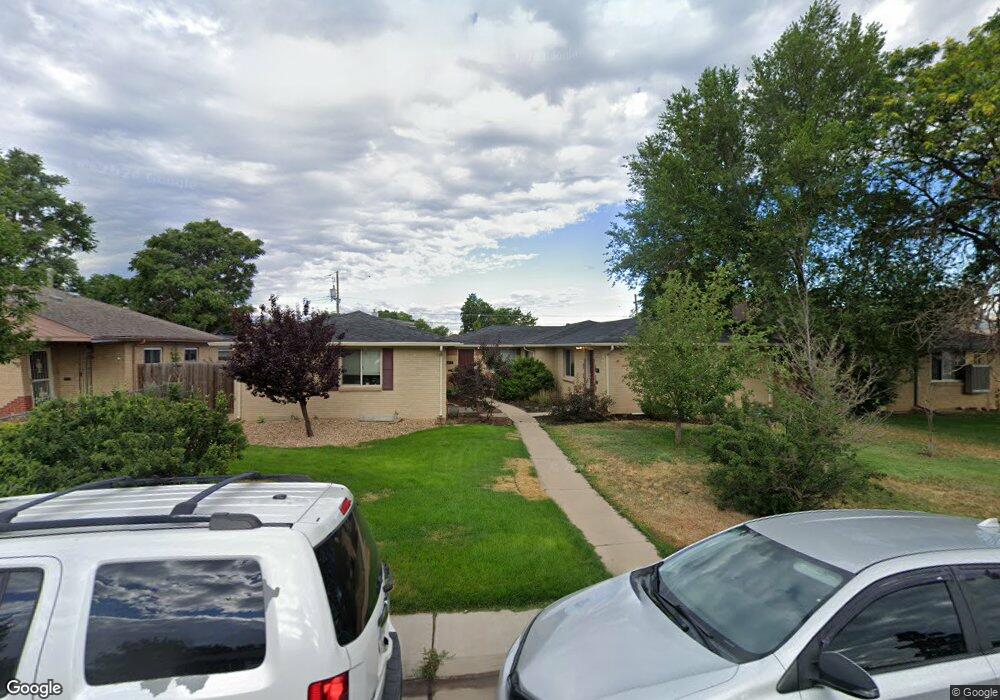
3655 N Locust St Denver, CO 80207
Northeast Park Hill NeighborhoodEstimated Value: $433,000 - $492,000
3
Beds
2
Baths
1,716
Sq Ft
$268/Sq Ft
Est. Value
About This Home
This home is located at 3655 N Locust St, Denver, CO 80207 and is currently estimated at $459,623, approximately $267 per square foot. 3655 N Locust St is a home located in Denver County with nearby schools including Margaret M Smith Elementary School, William (Bill) Roberts ECE-8 School, and Denver Discovery School.
Ownership History
Date
Name
Owned For
Owner Type
Purchase Details
Closed on
Oct 20, 2021
Sold by
Wolf Sara
Bought by
Gruber Joseph and Gruber Yakira
Current Estimated Value
Home Financials for this Owner
Home Financials are based on the most recent Mortgage that was taken out on this home.
Original Mortgage
$436,500
Outstanding Balance
$398,047
Interest Rate
2.8%
Mortgage Type
New Conventional
Estimated Equity
$61,576
Purchase Details
Closed on
Jun 29, 2015
Sold by
Gorman Grey M and Gorman Karol T
Bought by
Wolf Sara
Home Financials for this Owner
Home Financials are based on the most recent Mortgage that was taken out on this home.
Original Mortgage
$240,562
Interest Rate
4.37%
Mortgage Type
FHA
Purchase Details
Closed on
Sep 4, 2009
Sold by
Evolution Development Llc
Bought by
Gorman Grey M and Gorman Karol T
Home Financials for this Owner
Home Financials are based on the most recent Mortgage that was taken out on this home.
Original Mortgage
$118,030
Interest Rate
5.26%
Mortgage Type
FHA
Create a Home Valuation Report for This Property
The Home Valuation Report is an in-depth analysis detailing your home's value as well as a comparison with similar homes in the area
Home Values in the Area
Average Home Value in this Area
Purchase History
| Date | Buyer | Sale Price | Title Company |
|---|---|---|---|
| Gruber Joseph | $450,000 | Heritage Title Company | |
| Wolf Sara | $245,000 | Fidelity National Title | |
| Gorman Grey M | $145,000 | Htco |
Source: Public Records
Mortgage History
| Date | Status | Borrower | Loan Amount |
|---|---|---|---|
| Open | Gruber Joseph | $436,500 | |
| Previous Owner | Wolf Sara | $240,562 | |
| Previous Owner | Gorman Grey M | $118,030 |
Source: Public Records
Tax History Compared to Growth
Tax History
| Year | Tax Paid | Tax Assessment Tax Assessment Total Assessment is a certain percentage of the fair market value that is determined by local assessors to be the total taxable value of land and additions on the property. | Land | Improvement |
|---|---|---|---|---|
| 2024 | $2,081 | $26,280 | $1,830 | $24,450 |
| 2023 | $2,036 | $26,280 | $1,830 | $24,450 |
| 2022 | $2,164 | $27,210 | $3,820 | $23,390 |
| 2021 | $2,164 | $28,000 | $3,930 | $24,070 |
| 2020 | $1,798 | $24,230 | $3,930 | $20,300 |
| 2019 | $1,747 | $24,230 | $3,930 | $20,300 |
| 2018 | $1,502 | $19,420 | $2,570 | $16,850 |
| 2017 | $1,498 | $19,420 | $2,570 | $16,850 |
| 2016 | $1,105 | $13,550 | $2,619 | $10,931 |
| 2015 | $1,059 | $13,550 | $2,619 | $10,931 |
| 2014 | $848 | $10,210 | $1,751 | $8,459 |
Source: Public Records
Map
Nearby Homes
- 3690 Leyden St
- 3670 Magnolia St
- 3625 Kearney St
- 3675 Niagara St
- 3685 Jasmine St
- 3540 Niagara St
- 3360 Magnolia St
- 3327 Krameria St Unit ABC
- 3327 Krameria St
- 3398 Newport St
- 3285 N Monaco Street Pkwy
- 3269 Krameria St
- 3610 Olive St
- 3550 Holly St
- 3820 Olive St Unit 2
- 6335 Martin Luther King Junior Blvd
- 3311 Oneida St
- 6325 Martin Luther King Junior Blvd
- 3221 Krameria St
- 3536 Olive St