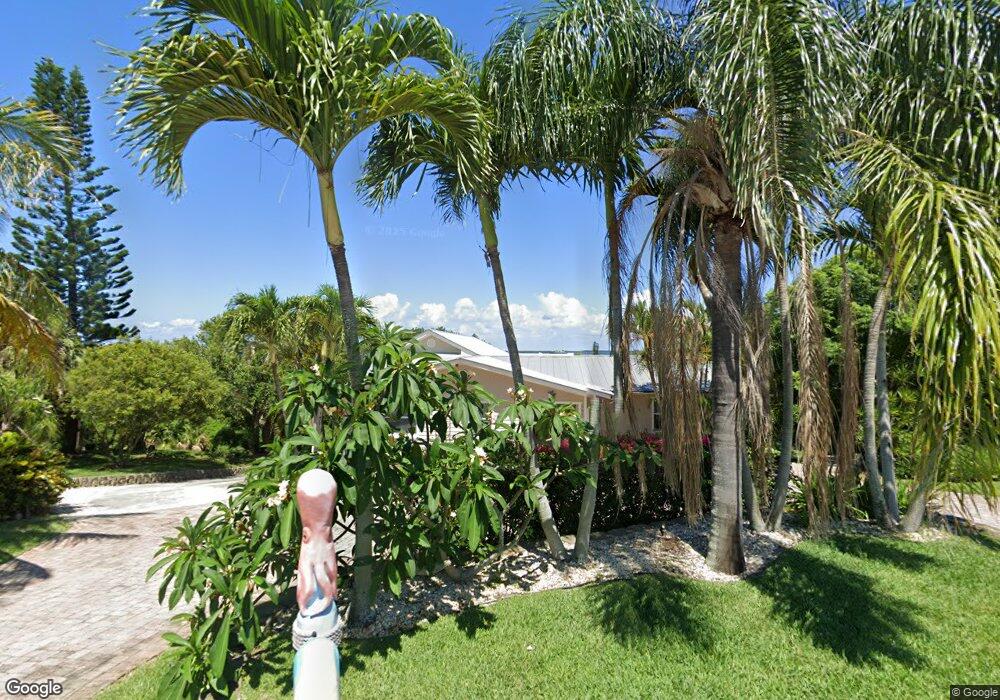
3655 NE Skyline Dr Jensen Beach, FL 34957
Estimated Value: $800,000 - $1,072,735
4
Beds
3
Baths
3,299
Sq Ft
$291/Sq Ft
Est. Value
About This Home
This home is located at 3655 NE Skyline Dr, Jensen Beach, FL 34957 and is currently estimated at $960,184, approximately $291 per square foot. 3655 NE Skyline Dr is a home located in Martin County with nearby schools including Jensen Beach Elementary School, Stuart Middle School, and Jensen Beach High School.
Ownership History
Date
Name
Owned For
Owner Type
Purchase Details
Closed on
Jun 30, 2017
Sold by
Brewer Bulk Cynthia and Bulk David N
Bought by
Allen Brian and Allen Kimberly
Current Estimated Value
Home Financials for this Owner
Home Financials are based on the most recent Mortgage that was taken out on this home.
Original Mortgage
$559,775
Outstanding Balance
$465,844
Interest Rate
3.95%
Mortgage Type
VA
Estimated Equity
$494,340
Purchase Details
Closed on
Dec 17, 2015
Sold by
Bulk David N and Brewer Bulk Cynthia
Bought by
Bulk Cynthia Brewer and Livin David N Bulk
Purchase Details
Closed on
Jun 11, 2002
Sold by
Walsh Jean A
Bought by
Bulk David N and Brewer Bulk Cindy
Home Financials for this Owner
Home Financials are based on the most recent Mortgage that was taken out on this home.
Original Mortgage
$150,000
Interest Rate
6.24%
Purchase Details
Closed on
Jan 1, 1973
Bought by
Cynthia Brewer & David Bulk Living T
Create a Home Valuation Report for This Property
The Home Valuation Report is an in-depth analysis detailing your home's value as well as a comparison with similar homes in the area
Home Values in the Area
Average Home Value in this Area
Purchase History
| Date | Buyer | Sale Price | Title Company |
|---|---|---|---|
| Allen Brian | $605,000 | Liberty Title Co Of America | |
| Bulk Cynthia Brewer | -- | Attorney | |
| Bulk David N | $185,000 | -- | |
| Cynthia Brewer & David Bulk Living T | $14,500 | -- |
Source: Public Records
Mortgage History
| Date | Status | Borrower | Loan Amount |
|---|---|---|---|
| Open | Allen Brian | $559,775 | |
| Previous Owner | Bulk David N | $150,000 |
Source: Public Records
Tax History Compared to Growth
Tax History
| Year | Tax Paid | Tax Assessment Tax Assessment Total Assessment is a certain percentage of the fair market value that is determined by local assessors to be the total taxable value of land and additions on the property. | Land | Improvement |
|---|---|---|---|---|
| 2025 | $9,021 | $584,681 | -- | -- |
| 2024 | $8,858 | $568,204 | -- | -- |
| 2023 | $8,858 | $551,655 | $0 | $0 |
| 2022 | $8,559 | $535,588 | $0 | $0 |
| 2021 | $8,601 | $519,989 | $0 | $0 |
| 2020 | $8,473 | $512,810 | $0 | $0 |
| 2019 | $8,373 | $501,280 | $256,500 | $244,780 |
| 2018 | $8,903 | $533,979 | $0 | $0 |
| 2017 | $5,833 | $385,496 | $0 | $0 |
| 2016 | $6,045 | $377,567 | $0 | $0 |
| 2015 | $5,744 | $374,943 | $0 | $0 |
| 2014 | $5,744 | $371,967 | $0 | $0 |
Source: Public Records
Map
Nearby Homes
- 1511 NE 35th Terrace
- 1395 NE Flora Place
- 3830 NE Indian River Dr Unit 86
- 3834 NE Barbara Dr
- 3773 NE Barbara Dr
- 3840 NE Cheri Dr
- 1593 NE Orion St
- 3900 NE Cheri Dr
- 1313 NE Jensen Beach Blvd
- 1305 NE Meyers Terrace
- 4160 NE Indian River Dr
- 4224 NE Skyline Dr
- 4245 NE Sunset Dr
- 1550 NE Skyhigh Terrace
- 1252 NE South St
- 50 NE Driftwood Dr
- 880 NE Stokes Terrace
- 151 NE Buoy Dr
- 2859 NE Hickory Ridge Ave
- 2751 NE Breezeway Cir
- 3665 NE Skyline Dr
- 3615 NE Skyline Dr
- 3636 NE Skyline Dr
- 3656 NE Skyline Dr
- 3675 NE Skyline Dr
- 3616 NE Skyline Dr
- 3676 NE Skyline Dr
- 3596 NE Skyline Dr
- 3705 NE Skyline Dr
- 3585 NE Skyline Dr
- 3637 NE Jeannette Dr
- 3627 NE Jeannette Dr
- 3695 NE Skyline Dr
- 3647 NE Jeannette Dr
- 3617 NE Jeannette Dr
- 3576 NE Skyline Dr
- 3725 NE Skyline Dr
- 3657 NE Jeannette Dr
- 3736 NE Skyline Dr
- 3556 NE Skyline Dr