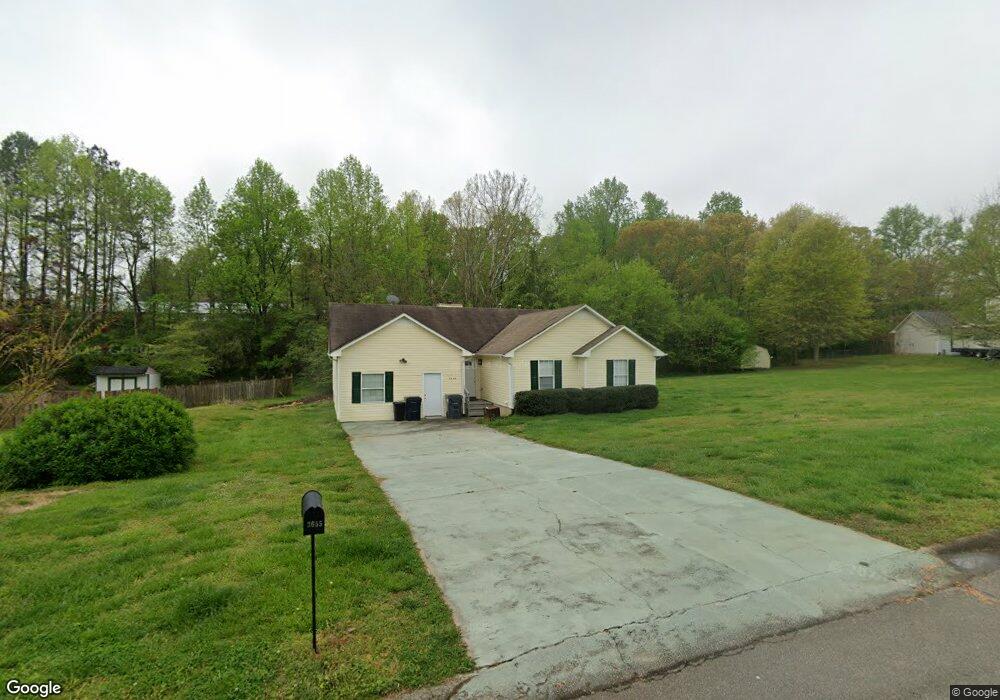
3655 Wofford Dr Unit 11 Cumming, GA 30028
Estimated Value: $396,000 - $476,000
3
Beds
2
Baths
1,553
Sq Ft
$272/Sq Ft
Est. Value
About This Home
This home is located at 3655 Wofford Dr Unit 11, Cumming, GA 30028 and is currently estimated at $422,475, approximately $272 per square foot. 3655 Wofford Dr Unit 11 is a home located in Forsyth County with nearby schools including Coal Mountain Elementary School, North Forsyth Middle School, and North Forsyth High School.
Ownership History
Date
Name
Owned For
Owner Type
Purchase Details
Closed on
Jun 14, 2021
Sold by
Martin Theodore F
Bought by
Allred Corey Holcombe and Allred Jason Taylor
Current Estimated Value
Home Financials for this Owner
Home Financials are based on the most recent Mortgage that was taken out on this home.
Original Mortgage
$270,019
Outstanding Balance
$244,469
Interest Rate
2.9%
Mortgage Type
FHA
Estimated Equity
$178,006
Purchase Details
Closed on
Oct 15, 2011
Sold by
Martin Rhonda C
Bought by
Martin Theodore F
Purchase Details
Closed on
Apr 18, 1997
Sold by
G A B S Prop Inc
Bought by
Martin Theodore F and Martin Rhonda C
Home Financials for this Owner
Home Financials are based on the most recent Mortgage that was taken out on this home.
Original Mortgage
$80,900
Interest Rate
7.92%
Mortgage Type
New Conventional
Create a Home Valuation Report for This Property
The Home Valuation Report is an in-depth analysis detailing your home's value as well as a comparison with similar homes in the area
Home Values in the Area
Average Home Value in this Area
Purchase History
| Date | Buyer | Sale Price | Title Company |
|---|---|---|---|
| Allred Corey Holcombe | $275,000 | -- | |
| Martin Theodore F | -- | -- | |
| Martin Theodore F | $89,900 | -- |
Source: Public Records
Mortgage History
| Date | Status | Borrower | Loan Amount |
|---|---|---|---|
| Open | Allred Corey Holcombe | $270,019 | |
| Previous Owner | Martin Theodore F | $80,900 |
Source: Public Records
Tax History Compared to Growth
Tax History
| Year | Tax Paid | Tax Assessment Tax Assessment Total Assessment is a certain percentage of the fair market value that is determined by local assessors to be the total taxable value of land and additions on the property. | Land | Improvement |
|---|---|---|---|---|
| 2025 | $3,575 | $154,764 | $46,000 | $108,764 |
| 2024 | $3,575 | $145,800 | $40,000 | $105,800 |
| 2023 | $3,068 | $124,628 | $32,000 | $92,628 |
| 2022 | $2,698 | $85,084 | $24,000 | $61,084 |
| 2021 | $1,941 | $85,084 | $24,000 | $61,084 |
| 2020 | $1,873 | $81,784 | $24,000 | $57,784 |
| 2019 | $1,867 | $81,360 | $24,000 | $57,360 |
| 2018 | $1,515 | $63,780 | $18,000 | $45,780 |
| 2017 | $1,452 | $60,488 | $18,000 | $42,488 |
| 2016 | $1,497 | $62,648 | $16,000 | $46,648 |
| 2015 | $1,370 | $56,488 | $14,000 | $42,488 |
| 2014 | $1,184 | $50,988 | $12,000 | $38,988 |
Source: Public Records
Map
Nearby Homes
- 3530 Dahlonega Hwy
- 3534 Dahlonega Hwy
- The Colton Plan at Sierra Lake
- The Beckett Plan at Sierra Lake
- The Charleston Plan at Sierra Lake
- The Claire Plan at Sierra Lake
- The Margaret Plan at Sierra Lake
- The Sophia Plan at Sierra Lake
- 4020 Sierra Knolls Ct
- 3995 Sierra Lake Dr
- 4010 Sierra Knolls Ct
- 3725 Sierra Lake Dr
- 3735 Sierra Lake Dr
- 3810 Sierra Lake Dr
- 3925 Mark Lake Rd
- 4015 Sierra Vista Cir
- 4070 Gold Hill Ln
- 4420 Belcrest Way
- 4095 Sierra Vista Cir
- 4115 Sierra Vista Cir
- 3655 Wofford Dr
- 3635 Wofford Dr
- 3665 Wofford Dr
- 3650 Wofford Dr
- 3660 Wofford Dr
- 3675 Wofford Dr
- 3640 Wofford Dr
- 3625 Wofford Dr
- 0 Wofford Dr Unit 7184762
- 0 Wofford Dr Unit 8812531
- 0 Wofford Dr Unit 8448101
- 0 Wofford Dr Unit 8396510
- 0 Wofford Dr Unit 8357282
- 0 Wofford Dr
- 3670 Wofford Dr
- 3630 Wofford Dr
- 3610 Cary Cir
- 3620 Wofford Dr
- 3620 Cary Cir
- 3570 Wofford Dr