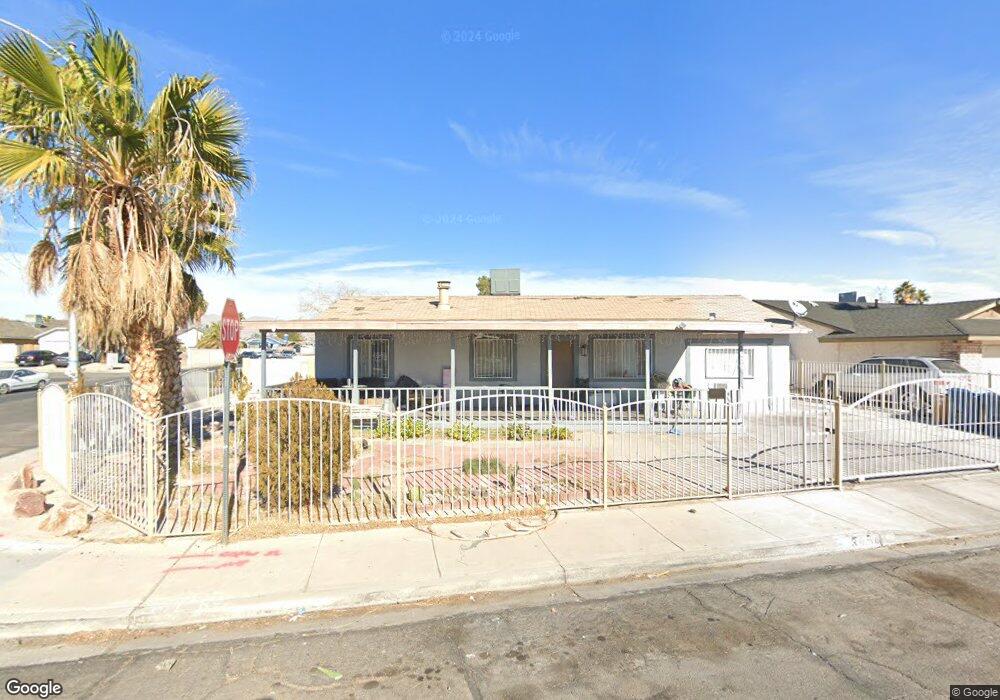
3656 E Colton Ave Las Vegas, NV 89115
Estimated Value: $288,000 - $334,000
3
Beds
2
Baths
988
Sq Ft
$318/Sq Ft
Est. Value
About This Home
This home is located at 3656 E Colton Ave, Las Vegas, NV 89115 and is currently estimated at $314,179, approximately $317 per square foot. 3656 E Colton Ave is a home located in Clark County with nearby schools including Clyde C. Cox Elementary School, Gwendolyn Woolley Elementary School, and Von Tobel Middle School.
Ownership History
Date
Name
Owned For
Owner Type
Purchase Details
Closed on
Dec 4, 2003
Sold by
Valine Norman
Bought by
Pereda Casarez Gerardo and Ruacho Rita
Current Estimated Value
Home Financials for this Owner
Home Financials are based on the most recent Mortgage that was taken out on this home.
Original Mortgage
$109,285
Interest Rate
6.02%
Mortgage Type
FHA
Purchase Details
Closed on
Dec 16, 2002
Sold by
Turner Skipper Dean
Bought by
Valine Norman and The 3656 Turner Trust
Purchase Details
Closed on
Aug 21, 2000
Sold by
Turner Jennifer
Bought by
Turner Skipper Dean
Purchase Details
Closed on
Apr 12, 1996
Sold by
Turner Jennifer L
Bought by
Turner Skipper D and Turner Jennifer L
Home Financials for this Owner
Home Financials are based on the most recent Mortgage that was taken out on this home.
Original Mortgage
$56,800
Interest Rate
7.41%
Create a Home Valuation Report for This Property
The Home Valuation Report is an in-depth analysis detailing your home's value as well as a comparison with similar homes in the area
Home Values in the Area
Average Home Value in this Area
Purchase History
| Date | Buyer | Sale Price | Title Company |
|---|---|---|---|
| Pereda Casarez Gerardo | $111,000 | United Title Of Nevada | |
| Valine Norman | $74,200 | Lawyers Title | |
| Turner Skipper Dean | -- | -- | |
| Turner Skipper D | -- | Nevada Title Company | |
| Turner Jennifer L | -- | Nevada Title Company |
Source: Public Records
Mortgage History
| Date | Status | Borrower | Loan Amount |
|---|---|---|---|
| Previous Owner | Pereda Casarez Gerardo | $109,285 | |
| Previous Owner | Turner Jennifer L | $56,800 |
Source: Public Records
Tax History Compared to Growth
Tax History
| Year | Tax Paid | Tax Assessment Tax Assessment Total Assessment is a certain percentage of the fair market value that is determined by local assessors to be the total taxable value of land and additions on the property. | Land | Improvement |
|---|---|---|---|---|
| 2025 | $678 | $45,099 | $24,500 | $20,599 |
| 2024 | $628 | $45,099 | $24,500 | $20,599 |
| 2023 | $628 | $46,647 | $26,250 | $20,397 |
| 2022 | $582 | $41,824 | $22,750 | $19,074 |
| 2021 | $539 | $37,755 | $19,250 | $18,505 |
| 2020 | $498 | $37,206 | $18,550 | $18,656 |
| 2019 | $467 | $34,169 | $15,400 | $18,769 |
| 2018 | $445 | $29,045 | $10,710 | $18,335 |
| 2017 | $814 | $27,744 | $8,925 | $18,819 |
| 2016 | $418 | $20,739 | $8,050 | $12,689 |
| 2015 | $416 | $20,378 | $6,300 | $14,078 |
| 2014 | $403 | $13,333 | $3,500 | $9,833 |
Source: Public Records
Map
Nearby Homes
- 3630 Three Bars Ct
- 3540 Purdue
- 3327 Rio Grande St
- 3401 N Walnut Rd Unit 330
- 3401 N Walnut Rd Unit 121
- 3401 N Walnut Rd Unit 113
- 3401 N Walnut Rd Unit 109
- 3401 N Walnut Rd Unit 388
- 3401 N Walnut Rd Unit 235
- 3401 N Walnut Rd Unit 15
- 3401 N Walnut Rd Unit 236
- 3401 N Walnut Rd Unit 74
- 3401 N Walnut Rd Unit 13
- 3401 N Walnut Rd Unit 6
- 3401 N Walnut Rd Unit 402
- 3401 N Walnut Rd Unit 249
- 3401 N Walnut Rd Unit 304
- 3401 N Walnut Rd Unit 67
- 3401 N Walnut Rd Unit 107
- 3401 N Walnut Rd Unit 272
- 3668 E Colton Ave
- 3416 Covey Ln
- 3647 Elegant Saint Ct
- 3680 E Colton Ave
- 3426 Covey Ln
- 3641 Elegant Saint Ct
- 3657 E Colton Ave
- 3669 E Colton Ave
- 3635 Elegant Saint Ct
- 3648 Elegant Saint Ct
- 3415 Sandy Ln
- 3692 E Colton Ave
- 3436 Covey Ln
- 3681 E Colton Ave
- 3642 Elegant Saint Ct
- 3629 Elegant Saint Ct
- 3425 Sandy Ln
- 3385 Covey Ln
- 3636 Elegant Saint Ct
- 3366 Covey Ln