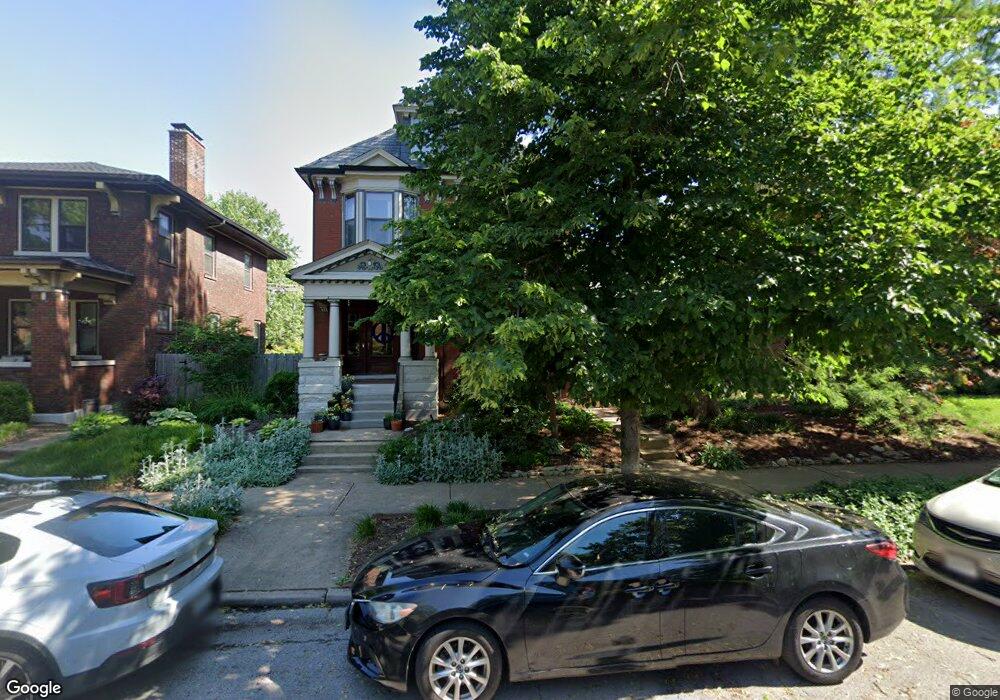
3657 Utah Place Saint Louis, MO 63116
Tower Grove South NeighborhoodEstimated Value: $478,000 - $639,000
--
Bed
4
Baths
2,184
Sq Ft
$258/Sq Ft
Est. Value
About This Home
This home is located at 3657 Utah Place, Saint Louis, MO 63116 and is currently estimated at $562,652, approximately $257 per square foot. 3657 Utah Place is a home located in St. Louis City with nearby schools including Mann Elementary School, Roosevelt High School, and Momentum Academy Tower Grove East.
Ownership History
Date
Name
Owned For
Owner Type
Purchase Details
Closed on
Mar 26, 2007
Sold by
Carson William M and Drummond Amy E
Bought by
Carson William M and Drummond Amy E
Current Estimated Value
Home Financials for this Owner
Home Financials are based on the most recent Mortgage that was taken out on this home.
Original Mortgage
$416,500
Outstanding Balance
$252,381
Interest Rate
6.19%
Mortgage Type
Stand Alone Refi Refinance Of Original Loan
Estimated Equity
$310,272
Purchase Details
Closed on
May 2, 2005
Sold by
Goldmar Investments Llc
Bought by
Carson William
Home Financials for this Owner
Home Financials are based on the most recent Mortgage that was taken out on this home.
Original Mortgage
$359,650
Interest Rate
6.06%
Mortgage Type
Fannie Mae Freddie Mac
Purchase Details
Closed on
Sep 26, 2002
Sold by
Quellette Tad
Bought by
Holland Richard
Purchase Details
Closed on
Oct 26, 2000
Sold by
Ermatinger Charles J
Bought by
Goldmar Investments Llc
Create a Home Valuation Report for This Property
The Home Valuation Report is an in-depth analysis detailing your home's value as well as a comparison with similar homes in the area
Home Values in the Area
Average Home Value in this Area
Purchase History
| Date | Buyer | Sale Price | Title Company |
|---|---|---|---|
| Carson William M | -- | Ort | |
| Carson William | -- | Ort | |
| Holland Richard | -- | -- | |
| Goldmar Investments Llc | -- | Investors Title Co |
Source: Public Records
Mortgage History
| Date | Status | Borrower | Loan Amount |
|---|---|---|---|
| Open | Carson William M | $416,500 | |
| Closed | Carson William | $359,650 |
Source: Public Records
Tax History Compared to Growth
Tax History
| Year | Tax Paid | Tax Assessment Tax Assessment Total Assessment is a certain percentage of the fair market value that is determined by local assessors to be the total taxable value of land and additions on the property. | Land | Improvement |
|---|---|---|---|---|
| 2025 | $8,112 | $113,090 | $4,750 | $108,340 |
| 2024 | $7,714 | $96,570 | $4,750 | $91,820 |
| 2023 | $7,714 | $96,570 | $4,750 | $91,820 |
| 2022 | $7,288 | $87,830 | $4,750 | $83,080 |
| 2021 | $7,208 | $86,990 | $4,750 | $82,240 |
| 2020 | $6,275 | $76,270 | $4,750 | $71,520 |
| 2019 | $6,253 | $76,270 | $4,750 | $71,520 |
| 2018 | $5,797 | $68,510 | $4,160 | $64,350 |
| 2017 | $5,698 | $68,510 | $4,160 | $64,350 |
| 2016 | $5,420 | $64,330 | $4,160 | $60,170 |
| 2015 | $4,911 | $64,330 | $4,160 | $60,170 |
| 2014 | $4,707 | $64,330 | $4,160 | $60,170 |
| 2013 | -- | $61,690 | $4,160 | $57,530 |
Source: Public Records
Map
Nearby Homes
- 3407 Giles Ave
- 3808 Wyoming St
- 3521-3525 Utah St
- 3531 Cherokee St
- 3467 Grace Ave
- 3467 Giles Ave
- 3434 Humphrey St
- 3522 S Spring Ave
- 3823 Potomac St
- 3535 Giles Ave
- 3534 Giles Ave
- 3414 Cherokee St
- 3526 Bamberger Ave
- 3525 Hartford St
- 3449 Tennessee Ave
- 3937 Humphrey St
- 3931 Wyoming St
- 3324 Wyoming St
- 3546 Bamberger Ave
- 3304 Utah St
- 3651 Utah Place
- 3661 Utah Place
- 3645 Utah Place
- 3667 Utah Place
- 3656 Humphrey St
- 3654 Humphrey St
- 3660 Humphrey St
- 3703 Utah Place
- 3650 Humphrey St
- 3662 Humphrey St
- 3646 Humphrey St
- 3666 Humphrey St
- 3644 Humphrey St
- 3637 Utah Place
- 3707 Utah Place
- 3640 Humphrey St
- 3704 Humphrey St
- 3631 N Utah Place
- 3631 Utah Place
- 3711 Utah Place