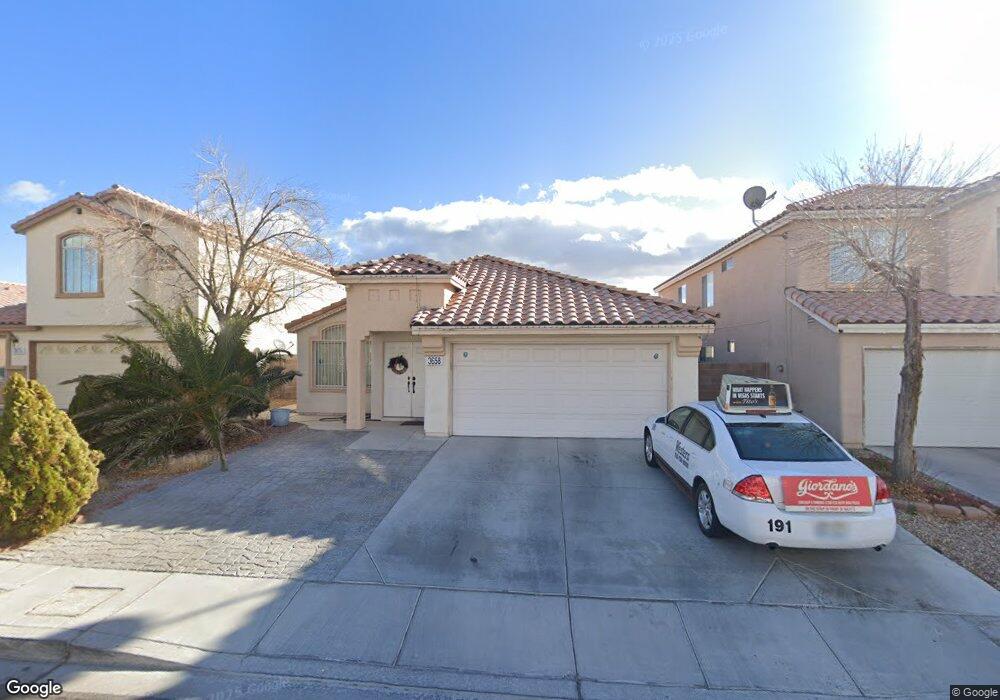
3658 Summer Picnic Ct Las Vegas, NV 89147
Estimated Value: $435,845 - $448,000
3
Beds
2
Baths
1,574
Sq Ft
$282/Sq Ft
Est. Value
About This Home
This home is located at 3658 Summer Picnic Ct, Las Vegas, NV 89147 and is currently estimated at $443,961, approximately $282 per square foot. 3658 Summer Picnic Ct is a home located in Clark County with nearby schools including Roger M Bryan Elementary School, Clifford J Lawrence Junior High School, and Spring Valley High School.
Ownership History
Date
Name
Owned For
Owner Type
Purchase Details
Closed on
May 5, 2023
Sold by
Kimo Ashenafi Ahmed
Bought by
Alemayehu Tinebeb and Alemayehu Kimo Ashenafi
Current Estimated Value
Purchase Details
Closed on
Mar 30, 2011
Sold by
Osman Rahwa
Bought by
Kimo Adam A
Home Financials for this Owner
Home Financials are based on the most recent Mortgage that was taken out on this home.
Original Mortgage
$133,206
Interest Rate
5.5%
Mortgage Type
FHA
Purchase Details
Closed on
Mar 27, 2007
Sold by
Wong Mike P and Wong Amy Y
Bought by
Osman Rahwa
Home Financials for this Owner
Home Financials are based on the most recent Mortgage that was taken out on this home.
Original Mortgage
$228,000
Interest Rate
6.5%
Mortgage Type
Unknown
Purchase Details
Closed on
Mar 25, 1994
Sold by
Lewis Homes Of Nevada
Bought by
Wong Mike P and Wongg Amy Y
Home Financials for this Owner
Home Financials are based on the most recent Mortgage that was taken out on this home.
Original Mortgage
$85,000
Interest Rate
8.8%
Create a Home Valuation Report for This Property
The Home Valuation Report is an in-depth analysis detailing your home's value as well as a comparison with similar homes in the area
Home Values in the Area
Average Home Value in this Area
Purchase History
| Date | Buyer | Sale Price | Title Company |
|---|---|---|---|
| Alemayehu Tinebeb | -- | None Listed On Document | |
| Kimo Adam A | $135,000 | Netco | |
| Osman Rahwa | $285,000 | Nevada Title Company | |
| Wong Mike P | $122,000 | Old Republic Title Company |
Source: Public Records
Mortgage History
| Date | Status | Borrower | Loan Amount |
|---|---|---|---|
| Previous Owner | Kimo Adam A | $133,206 | |
| Previous Owner | Osman Rahwa | $228,000 | |
| Previous Owner | Wong Mike P | $85,000 |
Source: Public Records
Tax History Compared to Growth
Tax History
| Year | Tax Paid | Tax Assessment Tax Assessment Total Assessment is a certain percentage of the fair market value that is determined by local assessors to be the total taxable value of land and additions on the property. | Land | Improvement |
|---|---|---|---|---|
| 2025 | $1,756 | $91,264 | $37,100 | $54,164 |
| 2024 | $1,857 | $91,264 | $37,100 | $54,164 |
| 2023 | $1,857 | $83,914 | $32,200 | $51,714 |
| 2022 | $1,816 | $74,679 | $27,300 | $47,379 |
| 2021 | $1,681 | $67,577 | $22,400 | $45,177 |
| 2020 | $1,558 | $67,018 | $22,050 | $44,968 |
| 2019 | $1,460 | $65,760 | $21,350 | $44,410 |
| 2018 | $1,394 | $59,638 | $16,800 | $42,838 |
| 2017 | $1,696 | $57,836 | $14,350 | $43,486 |
| 2016 | $1,305 | $56,324 | $12,600 | $43,724 |
| 2015 | $1,302 | $53,941 | $11,550 | $42,391 |
| 2014 | $1,264 | $41,811 | $9,100 | $32,711 |
Source: Public Records
Map
Nearby Homes
- 3685 Springbud Dr
- 7938 Angel Tree Ct
- 8003 Retriever Ave
- 3749 Climbing Rose St
- 3637 Pinnate Dr
- 3634 Surfboard Ct
- 8109 Retriever Ave
- 3722 Violet Rose Ct
- 8139 Retriever Ave
- 8143 Retriever Ave
- 3372 Ceremony Dr
- 3359 Commendation Dr
- 3508 Harbor Tides St
- 8061 Petunia Flower Way
- 3746 Bombastic Ct
- 7968 Dinsmore Dr
- 3440 Meridale Dr
- 7954 Kentshire Dr
- 3869 Spruceview Ct
- 7929 Palace Monaco Ave
- 3650 Summer Picnic Ct
- 3650 Summer Picnic Ct Unit n/a
- 3674 Summer Picnic Ct
- 3642 Summer Picnic Ct
- 3655 Springbud Dr
- 3661 Springbud Dr
- 3661 Springbud Dr Unit n/a
- 3649 Springbud Dr
- 3667 Springbud Dr
- 3682 Summer Picnic Ct
- 3643 Springbud Dr
- 3639 Springbud Dr
- 3673 Springbud Dr
- 3659 Summer Picnic Ct
- 3667 Summer Picnic Ct
- 3651 Summer Picnic Ct
- 7841 Fall Harvest Dr
- 3643 Summer Picnic Ct
- 7835 Fall Harvest Dr
- 7847 Fall Harvest Dr