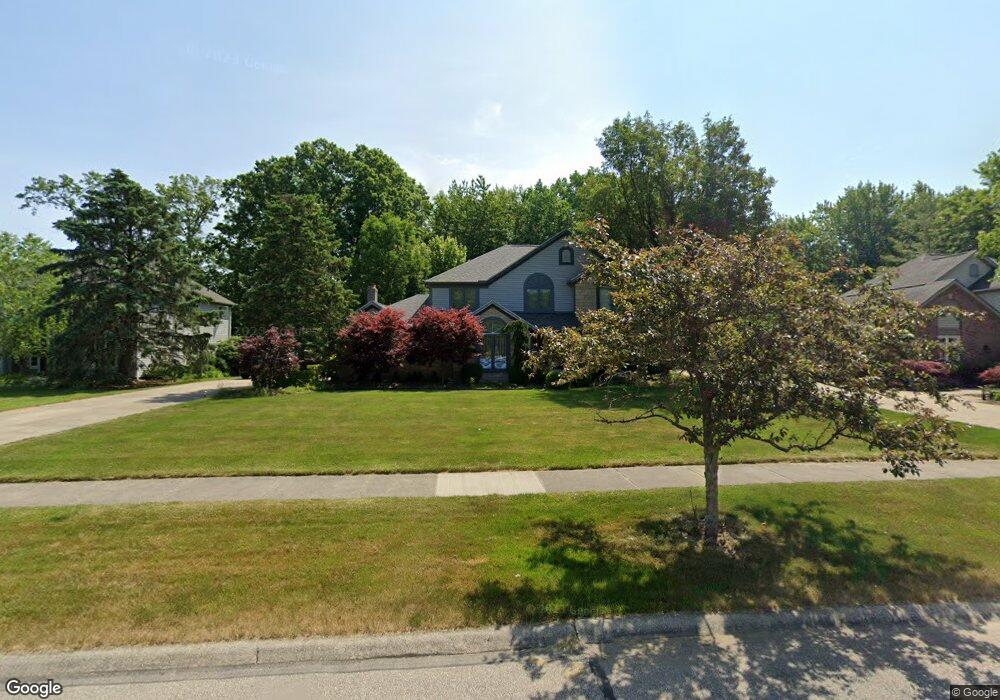
3659 Parsons Pond Cir Westlake, OH 44145
Estimated Value: $569,804 - $656,000
3
Beds
3
Baths
2,678
Sq Ft
$228/Sq Ft
Est. Value
About This Home
This home is located at 3659 Parsons Pond Cir, Westlake, OH 44145 and is currently estimated at $610,201, approximately $227 per square foot. 3659 Parsons Pond Cir is a home located in Cuyahoga County with nearby schools including Dover Intermediate School, Lee Burneson Middle School, and Westlake High School.
Ownership History
Date
Name
Owned For
Owner Type
Purchase Details
Closed on
Jun 12, 1998
Sold by
Chang Abu Zahra Hong
Bought by
Munshower Robert G and Munshower Deborah
Current Estimated Value
Purchase Details
Closed on
Jul 30, 1997
Sold by
Caruso Jill L
Bought by
Zahra Hong Chang Abu
Home Financials for this Owner
Home Financials are based on the most recent Mortgage that was taken out on this home.
Original Mortgage
$60,000
Interest Rate
7.71%
Mortgage Type
New Conventional
Purchase Details
Closed on
Oct 12, 1995
Sold by
Divito Laurence J
Bought by
Caruso Jill L
Home Financials for this Owner
Home Financials are based on the most recent Mortgage that was taken out on this home.
Original Mortgage
$100,000
Interest Rate
7.32%
Mortgage Type
New Conventional
Purchase Details
Closed on
Feb 7, 1991
Bought by
Divito Laurence J
Purchase Details
Closed on
Jan 1, 1989
Bought by
Fairland Bldrs Inc
Create a Home Valuation Report for This Property
The Home Valuation Report is an in-depth analysis detailing your home's value as well as a comparison with similar homes in the area
Home Values in the Area
Average Home Value in this Area
Purchase History
| Date | Buyer | Sale Price | Title Company |
|---|---|---|---|
| Munshower Robert G | $277,500 | Commonwealth | |
| Zahra Hong Chang Abu | $275,000 | -- | |
| Caruso Jill L | $265,000 | -- | |
| Divito Laurence J | $214,000 | -- | |
| Fairland Bldrs Inc | -- | -- |
Source: Public Records
Mortgage History
| Date | Status | Borrower | Loan Amount |
|---|---|---|---|
| Previous Owner | Zahra Hong Chang Abu | $60,000 | |
| Previous Owner | Caruso Jill L | $100,000 |
Source: Public Records
Tax History Compared to Growth
Tax History
| Year | Tax Paid | Tax Assessment Tax Assessment Total Assessment is a certain percentage of the fair market value that is determined by local assessors to be the total taxable value of land and additions on the property. | Land | Improvement |
|---|---|---|---|---|
| 2024 | $8,591 | $177,205 | $36,610 | $140,595 |
| 2023 | $7,986 | $140,880 | $37,520 | $103,360 |
| 2022 | $7,861 | $140,875 | $37,520 | $103,355 |
| 2021 | $7,878 | $140,880 | $37,520 | $103,360 |
| 2020 | $8,337 | $136,780 | $36,440 | $100,350 |
| 2019 | $8,088 | $390,800 | $104,100 | $286,700 |
| 2018 | $8,004 | $136,780 | $36,440 | $100,350 |
| 2017 | $7,957 | $126,010 | $28,040 | $97,970 |
| 2016 | $7,917 | $126,010 | $28,040 | $97,970 |
| 2015 | $7,207 | $126,010 | $28,040 | $97,970 |
| 2014 | $7,207 | $112,500 | $25,030 | $87,470 |
Source: Public Records
Map
Nearby Homes
- S/L 5 Bradley Rd
- S/L 4 Bradley Rd
- 3133 Waterfall Way
- Scottsdale Plan at The Reserve at Mass Estates - Estate Series
- Rockport Plan at The Reserve at Mass Estates - Estate Series
- Rivendale Plan at The Reserve at Mass Estates - Estate Series
- Mayfield Plan at The Reserve at Mass Estates - Estate Series
- Kensington Plan at The Reserve at Mass Estates - Estate Series
- Aspen Plan at The Reserve at Mass Estates - Estate Series
- 3115 Bradley Rd
- 3402 Mass Dr
- The Mahogony III Plan at Fieldstone Landings
- The Bexley III Plan at Fieldstone Landings
- The Prescott Plan at Fieldstone Landings
- The Baldwin Plan at Fieldstone Landings
- The Winchester Plan at Fieldstone Landings
- The Ashley Plan at Fieldstone Landings
- The Berkley Plan at Fieldstone Landings
- The Forestwood Plan at Fieldstone Landings
- The Bexley 55 Plan at Fieldstone Landings
- 3651 Parsons Pond Cir
- 3667 Parsons Pond Cir
- 3643 Parsons Pond Cir
- 31269 E Churchill Ln
- 31328 Bishops Gate Cir
- 3664 Parsons Pond Cir
- 3656 Parsons Pond Cir
- 31296 Bishops Gate Cir
- 3672 Parsons Pond Cir
- 31268 Bishops Gate Cir
- 3648 Parsons Pond Cir
- 31211 E Churchill Ln
- 3680 Parsons Pond Cir
- 3640 Parsons Pond Cir
- 3627 Parsons Pond Cir
- 31520 Bishops Gate Cir
- 31218 Hilliard Blvd
- 31206 Hilliard Blvd
- 3632 Parsons Pond Cir
- 31203 E Churchill Ln