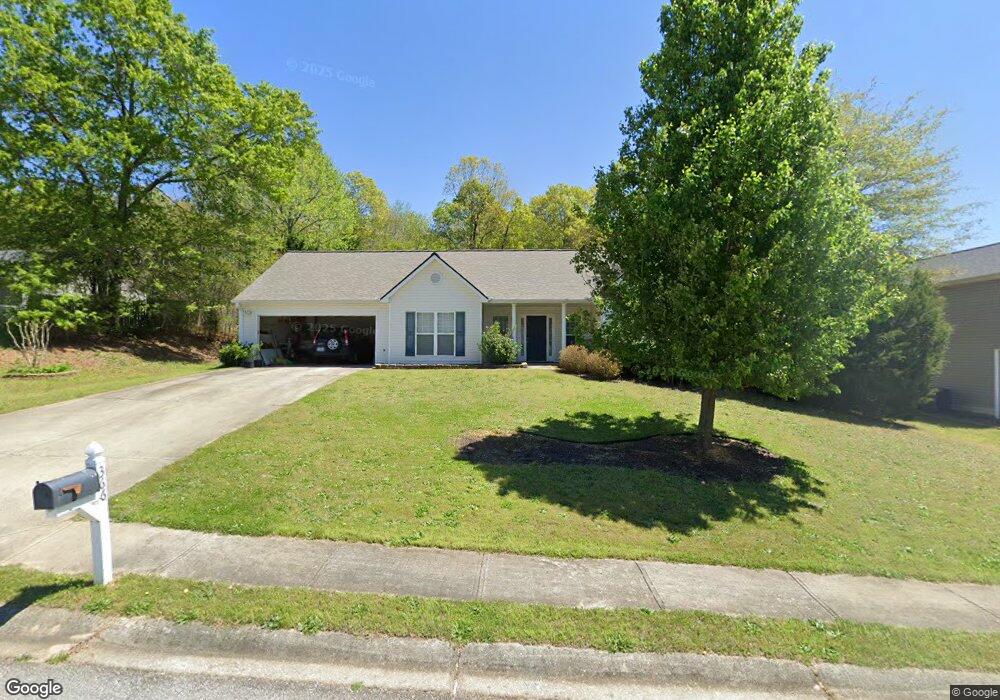
366 Centennial Dr Unit 1 Bethlehem, GA 30620
Estimated Value: $311,000 - $338,327
3
Beds
2
Baths
1,646
Sq Ft
$199/Sq Ft
Est. Value
About This Home
This home is located at 366 Centennial Dr Unit 1, Bethlehem, GA 30620 and is currently estimated at $327,082, approximately $198 per square foot. 366 Centennial Dr Unit 1 is a home located in Barrow County with nearby schools including Bethlehem Elementary School, Haymon-Morris Middle School, and Apalachee High School.
Ownership History
Date
Name
Owned For
Owner Type
Purchase Details
Closed on
Dec 4, 2018
Sold by
Todd Ryan M
Bought by
Montgomery Sandra
Current Estimated Value
Purchase Details
Closed on
Oct 7, 2016
Sold by
White Jason
Bought by
Todd Ryan M and Todd Jessica L
Home Financials for this Owner
Home Financials are based on the most recent Mortgage that was taken out on this home.
Original Mortgage
$146,969
Interest Rate
3.44%
Mortgage Type
New Conventional
Purchase Details
Closed on
Dec 14, 2007
Sold by
Southfork Hms Inc
Bought by
White Jason
Home Financials for this Owner
Home Financials are based on the most recent Mortgage that was taken out on this home.
Original Mortgage
$141,900
Interest Rate
6.15%
Mortgage Type
New Conventional
Purchase Details
Closed on
Nov 22, 2006
Sold by
Ansley Estates Llc
Bought by
Southfork Homes Inc
Purchase Details
Closed on
May 12, 2005
Sold by
See Sellers In Comments
Bought by
Ansley Estates Llc
Create a Home Valuation Report for This Property
The Home Valuation Report is an in-depth analysis detailing your home's value as well as a comparison with similar homes in the area
Home Values in the Area
Average Home Value in this Area
Purchase History
| Date | Buyer | Sale Price | Title Company |
|---|---|---|---|
| Montgomery Sandra | $170,000 | -- | |
| Todd Ryan M | $145,500 | -- | |
| White Jason | $141,900 | -- | |
| Southfork Homes Inc | $36,500 | -- | |
| Ansley Estates Llc | -- | -- |
Source: Public Records
Mortgage History
| Date | Status | Borrower | Loan Amount |
|---|---|---|---|
| Previous Owner | Todd Ryan M | $146,969 | |
| Previous Owner | White Jason | $141,900 |
Source: Public Records
Tax History Compared to Growth
Tax History
| Year | Tax Paid | Tax Assessment Tax Assessment Total Assessment is a certain percentage of the fair market value that is determined by local assessors to be the total taxable value of land and additions on the property. | Land | Improvement |
|---|---|---|---|---|
| 2024 | $3,051 | $124,477 | $22,800 | $101,677 |
| 2023 | $3,506 | $124,877 | $22,800 | $102,077 |
| 2022 | $2,616 | $92,643 | $22,800 | $69,843 |
| 2021 | $2,092 | $70,162 | $16,000 | $54,162 |
| 2020 | $2,026 | $67,922 | $16,000 | $51,922 |
| 2019 | $2,060 | $67,922 | $16,000 | $51,922 |
| 2018 | $1,856 | $62,012 | $11,800 | $50,212 |
| 2017 | $1,473 | $50,575 | $11,800 | $38,775 |
| 2016 | $1,234 | $42,663 | $11,800 | $30,863 |
| 2015 | $1,250 | $42,991 | $11,800 | $31,191 |
| 2014 | $1,126 | $38,672 | $7,154 | $31,518 |
| 2013 | -- | $36,351 | $7,154 | $29,197 |
Source: Public Records
Map
Nearby Homes
- 480 Raider Way
- 0 Tanners Bridge Cir Unit 10536031
- 3800 George Williams Rd
- 3153 Lowell Rd
- 468 Grand Oaks Ave
- 3680 Apalachee Ridge
- 1071 Covenant Ct
- 3589 Fannie Thompson Rd NW
- 3625 Fannie Thompson Rd NW
- 3601 Fannie Thompson Rd NW
- 1101 Ravenwood Dr
- 1035 Lucienne Blvd
- 1047 Lucienne Blvd
- 410 Providence Club Dr
- 103 Camp Ct
- 366 Centennial Dr
- 364 Centennial Dr Unit 44
- 364 Centennial Dr
- 368 Centennial Drive (Lot42)
- 368 Centennial Dr
- 368 Centennial Dr Unit 1
- 370 Centennial Dr
- 362 Centennial Dr
- 367 Centennial Dr
- 363 Centennial Dr Unit 1
- 363 Centennial Dr
- 432 Centennial Dr
- 361 Centennial Dr Unit 1
- 361 Centennial Dr
- 367 Centennial Drive (Lot36)
- 360 Centennial Dr
- 369 Centennial Dr
- 372 Centennial Dr
- 372 Centennial Dr Unit 1
- 359 Centennial Dr