Estimated Value: $472,065 - $500,000
About This Home
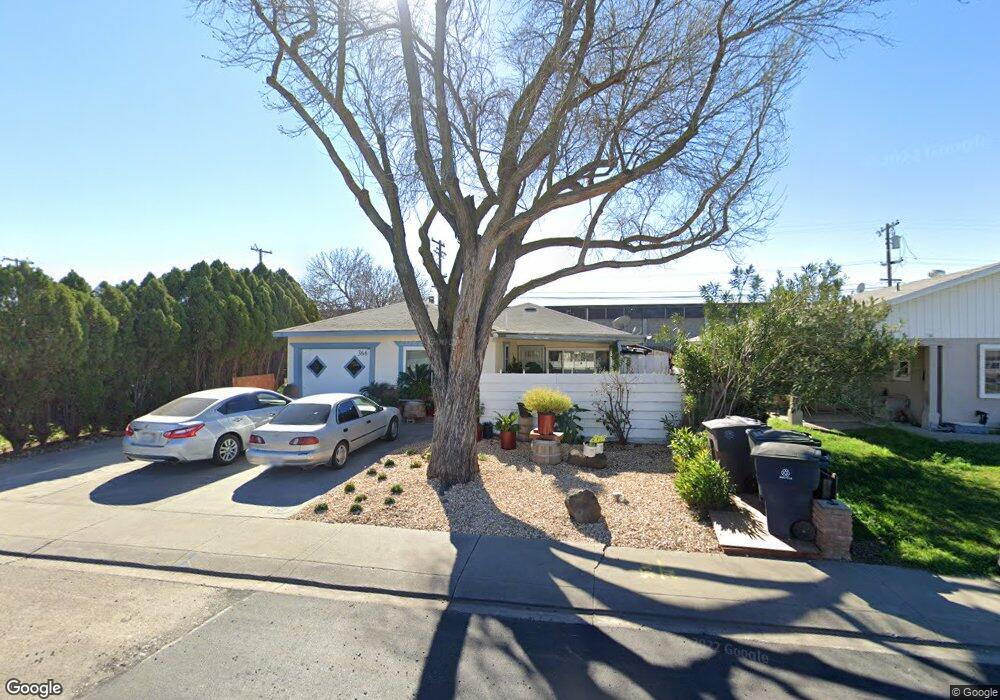
This home is located at 366 E 21st St, Tracy, CA 95376 and is currently estimated at $484,266, approximately $404 per square foot. 366 E 21st St is a home located in San Joaquin County with nearby schools including Central Elementary School, Tracy High School, and Primary Charter School.
Ownership History
We collect this data history from publicly available records. To have your information removed, we recommend requesting removal directly through your county’s website.
Purchase Details
Purchase Details
Purchase Details
Purchase Details
Home Financials for this Owner
Home Financials are based on the most recent Mortgage that was taken out on this home.Home Values in the Area
Average Home Value in this Area
Purchase History
We collect this data history from publicly available records. To have your information removed, we recommend requesting removal directly through your county’s website.
| Date | Buyer | Sale Price | Title Company |
|---|---|---|---|
| -- | None Available | ||
| $106,000 | Chicago Title Company | ||
| $92,000 | None Available | ||
| $143,000 | Old Republic Title Company |
Mortgage History
We collect this data history from publicly available records. To have your information removed, we recommend requesting removal directly through your county’s website.
| Date | Status | Borrower | Loan Amount |
|---|---|---|---|
| Previous Owner | $140,902 |
Tax History
We collect this data history from publicly available records. To have your information removed, we recommend requesting removal directly through your county’s website.
| Year | Tax Paid | Tax Assessment Tax Assessment Total Assessment is a certain percentage of the fair market value that is determined by local assessors to be the total taxable value of land and additions on the property. | Land | Improvement |
|---|---|---|---|---|
| 2025 | $1,590 | $136,815 | $33,556 | $103,259 |
| 2024 | $1,466 | $134,134 | $32,899 | $101,235 |
| 2023 | $1,443 | $131,504 | $32,254 | $99,250 |
| 2022 | $1,414 | $128,926 | $31,622 | $97,304 |
| 2021 | $1,397 | $126,399 | $31,002 | $95,397 |
| 2020 | $1,388 | $125,104 | $30,685 | $94,419 |
| 2019 | $1,367 | $122,652 | $30,084 | $92,568 |
| 2018 | $1,344 | $120,248 | $29,495 | $90,753 |
| 2017 | $1,277 | $117,891 | $28,917 | $88,974 |
| 2016 | $1,293 | $115,580 | $28,350 | $87,230 |
| 2015 | $1,281 | $113,845 | $27,924 | $85,921 |
| 2014 | $1,209 | $111,615 | $27,377 | $84,238 |
Map
- 360 E Grant Line Rd Unit 16
- 360 E Grant Line Rd Unit 11
- 222 Pereira Ave
- 158 E Grant Line Rd
- 124 E Lowell Ave
- 221 Granada Way
- 1525 Franklin Ave
- 2448 Altoga Ave
- 2929 N Macarthur Dr Unit 173
- 250 W 23rd St
- 34 W Carlton Way
- 1360 East St
- 3264 Ernest Dr
- 2388 Parker Ave
- 41 W Kavanagh Ave
- 1940 Wall St
- 3351 Cabrillo Dr
- 1719 Parker Ave
- 1930 Wall St
- 405 W 23rd St
Ask me questions while you tour the home.