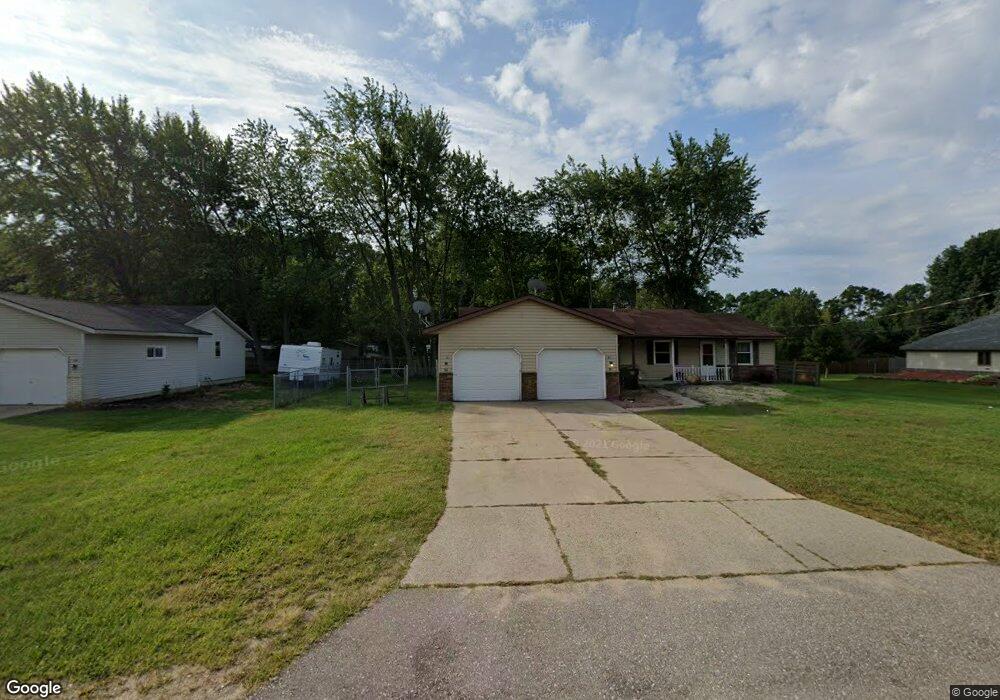
366 Felch St Holland, MI 49424
Estimated Value: $335,853 - $401,000
--
Bed
1
Bath
1,702
Sq Ft
$213/Sq Ft
Est. Value
About This Home
This home is located at 366 Felch St, Holland, MI 49424 and is currently estimated at $363,213, approximately $213 per square foot. 366 Felch St is a home located in Ottawa County with nearby schools including Woodside Elementary School, Macatawa Bay Middle School, and West Ottawa High School.
Ownership History
Date
Name
Owned For
Owner Type
Purchase Details
Closed on
Mar 19, 2021
Sold by
Pett Richard L
Bought by
Tinholt Aaron and Tinholt Kelli
Current Estimated Value
Purchase Details
Closed on
Aug 31, 2012
Sold by
Pett Richard L and Pett Ladonna D
Bought by
Pett Richard L
Home Financials for this Owner
Home Financials are based on the most recent Mortgage that was taken out on this home.
Original Mortgage
$134,185
Interest Rate
3.56%
Mortgage Type
VA
Create a Home Valuation Report for This Property
The Home Valuation Report is an in-depth analysis detailing your home's value as well as a comparison with similar homes in the area
Home Values in the Area
Average Home Value in this Area
Purchase History
| Date | Buyer | Sale Price | Title Company |
|---|---|---|---|
| Tinholt Aaron | $235,000 | Chicago Title Of Mi Inc | |
| Pett Richard L | -- | Genuine Title Llc |
Source: Public Records
Mortgage History
| Date | Status | Borrower | Loan Amount |
|---|---|---|---|
| Previous Owner | Pett Richard L | $134,185 |
Source: Public Records
Tax History Compared to Growth
Tax History
| Year | Tax Paid | Tax Assessment Tax Assessment Total Assessment is a certain percentage of the fair market value that is determined by local assessors to be the total taxable value of land and additions on the property. | Land | Improvement |
|---|---|---|---|---|
| 2025 | $5,949 | $131,400 | $0 | $0 |
| 2024 | $5,027 | $140,400 | $0 | $0 |
| 2023 | $4,823 | $125,300 | $0 | $0 |
| 2022 | $5,484 | $108,100 | $0 | $0 |
| 2021 | $3,382 | $98,700 | $0 | $0 |
| 2020 | $2,704 | $89,300 | $0 | $0 |
| 2019 | $2,716 | $48,900 | $0 | $0 |
| 2018 | $2,495 | $67,400 | $18,500 | $48,900 |
| 2017 | $2,453 | $67,600 | $0 | $0 |
| 2016 | $2,438 | $63,400 | $0 | $0 |
| 2015 | $2,347 | $62,100 | $0 | $0 |
| 2014 | $2,347 | $61,400 | $0 | $0 |
Source: Public Records
Map
Nearby Homes
- 790 Mayfield Ave
- 888 S Kingwood Ct
- 14145 Carol St
- 785 Mary Ave
- 490 James St
- 781 Shadybrook Dr
- 125 Liberty St
- 961 Shadybrook Dr
- 14298 Carol St
- 582 Hayes St
- 1020 Katra Ln Unit 52
- 320 Aniline Ave N Unit 10
- The Silverton Plan at West Ottawa Homesites
- The Poppy Plan at West Ottawa Homesites
- The Oakwood Plan at West Ottawa Homesites
- The Austen Plan at West Ottawa Homesites
- The Magnolia Plan at West Ottawa Homesites
- 2405 Burke Ave
- 459 Cherry Ln Unit 45
- 14061 Pheasant Run